Chrysler 2009 Annual Report Download - page 221
Download and view the complete annual report
Please find page 221 of the 2009 Chrysler annual report below. You can navigate through the pages in the report by either clicking on the pages listed below, or by using the keyword search tool below to find specific information within the annual report.-
 1
1 -
2
-
3
-
4
-
5
-
6
-
7
-
8
-
9
-
10
-
11
-
12
-
13
-
14
-
15
-
16
-
17
-
18
-
19
-
20
-
21
-
22
-
23
-
24
-
25
-
26
-
27
-
28
-
29
-
30
-
31
-
32
-
33
-
34
-
35
-
36
-
37
-
38
-
39
-
40
-
41
-
42
-
43
-
44
-
45
-
46
-
47
-
48
-
49
-
50
-
51
-
52
-
53
-
54
-
55
-
56
-
57
-
58
-
59
-
60
-
61
-
62
-
63
-
64
-
65
-
66
-
67
-
68
-
69
-
70
-
71
-
72
-
73
-
74
-
75
-
76
-
77
-
78
-
79
-
80
-
81
-
82
-
83
-
84
-
85
-
86
-
87
-
88
-
89
-
90
-
91
-
92
-
93
-
94
-
95
-
96
-
97
-
98
-
99
-
100
-
101
-
102
-
103
-
104
-
105
-
106
-
107
-
108
-
109
-
110
-
111
-
112
-
113
-
114
-
115
-
116
-
117
-
118
-
119
-
120
-
121
-
122
-
123
-
124
-
125
-
126
-
127
-
128
-
129
-
130
-
131
-
132
-
133
-
134
-
135
-
136
-
137
-
138
-
139
-
140
-
141
-
142
-
143
-
144
-
145
-
146
-
147
-
148
-
149
-
150
-
151
-
152
-
153
-
154
-
155
-
156
-
157
-
158
-
159
-
160
-
161
-
162
-
163
-
164
-
165
-
166
-
167
-
168
-
169
-
170
-
171
-
172
-
173
-
174
-
175
-
176
-
177
-
178
-
179
-
180
-
181
-
182
-
183
-
184
-
185
-
186
-
187
-
188
-
189
-
190
-
191
-
192
-
193
-
194
-
195
-
196
-
197
-
198
-
199
-
200
-
201
-
202
-
203
-
204
-
205
-
206
-
207
-
208
-
209
-
210
-
 211
211 -
 212
212 -
 213
213 -
 214
214 -
 215
215 -
 216
216 -
 217
217 -
 218
218 -
 219
219 -
 220
220 -
 221
221 -
 222
222 -
 223
223 -
 224
224 -
 225
225 -
 226
226 -
 227
227 -
 228
228 -
 229
229 -
 230
230 -
 231
231 -
232
-
233
-
234
-
235
-
236
-
237
-
238
-
239
-
240
-
241
-
242
-
243
-
244
-
245
-
246
-
247
-
248
-
249
-
250
-
251
-
252
-
253
-
254
-
255
-
256
-
257
-
258
-
259
-
260
-
261
-
262
-
263
-
264
-
265
-
266
-
267
-
268
-
269
-
270
-
271
-
272
-
273
-
274
-
275
-
276
-
277
-
278
-
279
-
280
-
281
-
282
-
283
-
284
-
285
-
286
-
287
-
288
-
289
-
290
-
291
-
292
-
293
-
294
-
295
-
296
-
297
-
298
-
299
-
300
-
301
-
302
-
303
-
304
-
305
-
306
-
307
-
308
-
309
-
310
-
311
-
312
-
313
-
314
-
315
-
316
-
317
-
318
-
319
-
320
-
321
-
322
-
323
-
324
-
325
-
326
-
327
-
328
-
329
-
330
-
331
-
332
-
333
-
334
-
335
-
336
-
337
-
338
-
339
-
340
-
341
-
342
-
343
-
344
-
345
-
346
-
347
-
348
-
349
-
350
-
351
-
352
-
353
-
354
-
355
-
356
-
357
-
358
-
359
-
360
-
361
-
362
-
363
-
364
-
365
-
366
-
367
-
368
-
369
-
370
-
371
-
372
-
373
-
374
 |
 |

220 FIAT GROUP
CONSOLIDATED
FINANCIAL
STATEMENTS
AT 31 DECEMBER
2009
NOTES
The Group assesses performance of its operating segments on the basis of Trading profit/(loss), Operating profit/(loss) and Result from investments made
by those segments.
Revenues for each reported segment are those directly generated by or attributable to the segment as a result of its usual business activities and include
revenues from transactions with third parties as well as those derived from transactions with other segments, recognised at normal market prices. For
those operating segments which also carry out financial services activities, revenues include interest income and other financial income derived from those
activities. Segment expenses represent expenses derived from each segment’s business activities both with third parties and other operating segments or
which may otherwise be directly attributable to it. Expenses derived from business activities with other segments are recognised at normal market prices.
For those operating segments which also carry out financial services activities, expenses include interest expense and other financial expense derived from
those activities.
The measure used to assess profit and loss for each operating segment is the Operating profit/(loss). Trading profit/(loss) is reported as a specific part of the
Operating profit/(loss) to separate the income and expense that is non-recurring in the ordinary operations of the business, such as gains and losses from
the disposals of investments or restructuring costs from profit or loss attributable to the Segments. Financial income and expense and taxes not derived
from operating activities are recognised centrally and reported under Unallocated items and adjustments.
All profit and loss items reported are recognised in accordance with the same accounting principles adopted for preparation of the Group’s consolidated
financial statements.
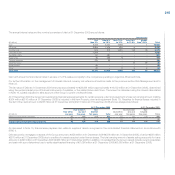
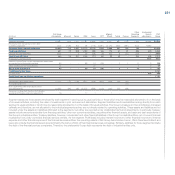
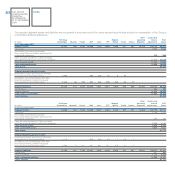
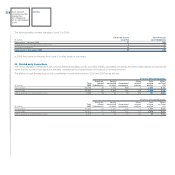
Details of the income statement by operating segment for the years ended 31 December 2009 and 2008 is as follows:
Other Unallocated
Fiat Group Magneti Operating items & FIAT
(€ million) Automobiles Maserati Ferrari CNH Iveco FPT Marelli Teksid Comau Segments adjustments Group
2009
Segment revenues 26,293 448 1,778 10,107 7,183 4,952 4,528 578 728 1,096 (7,589) 50,102
Revenues from transactions with other
operating segments (236) (48) (46) (30) (78) (4,163) (1,902) (222) (260) (604) 7,589 -
Revenues from external customers 26,057 400 1,732 10,077 7,105 789 2,626 356 468 492 - 50,102
Trading profit/(loss) 470 11 238 337 105 (25) 25 (12) (28) (79) 16 1,058
Unusual income/(expense) (253) - 7 (86) (195) (89) (65) (2) (4) (9) (3) (699)
Operating profit/(loss) 217 11 245 251 (90) (114) (40) (14) (32) (88) 13 359
Financial income/(expense) (753) (753)
Interest in profit/(loss) of joint ventures and associates
accounted for by the equity method 88 - - (26) (27) (24) (2) 3 1 (3) 8 18
Other profit/(loss) from investments 8 - - - (3) - (1) - - 5 - 9
Result from investments 96 - - (26) (30) (24) (3) 3 1 2 8 27
Profit/(loss) before taxes (367)
Income taxes 481 481
Profit/(loss) from continuing operations (848)
Amortisation and depreciation (1,224) (59) (194) (325) (380) (358) (263) (25) (15)
Goodwill impairment - - - - - - - - -
Non-cash items other than depreciation
and amortisation (1,543) (36) (43) (2,279) (618) (152) (126) (26) (20)
Reversal of impairment losses on Intangible
assets and Property, plan and equipment - - - - - 6 2 - -