Chrysler 2009 Annual Report Download - page 299
Download and view the complete annual report
Please find page 299 of the 2009 Chrysler annual report below. You can navigate through the pages in the report by either clicking on the pages listed below, or by using the keyword search tool below to find specific information within the annual report.-
 1
1 -
2
-
3
-
4
-
5
-
6
-
7
-
8
-
9
-
10
-
11
-
12
-
13
-
14
-
15
-
16
-
17
-
18
-
19
-
20
-
21
-
22
-
23
-
24
-
25
-
26
-
27
-
28
-
29
-
30
-
31
-
32
-
33
-
34
-
35
-
36
-
37
-
38
-
39
-
40
-
41
-
42
-
43
-
44
-
45
-
46
-
47
-
48
-
49
-
50
-
51
-
52
-
53
-
54
-
55
-
56
-
57
-
58
-
59
-
60
-
61
-
62
-
63
-
64
-
65
-
66
-
67
-
68
-
69
-
70
-
71
-
72
-
73
-
74
-
75
-
76
-
77
-
78
-
79
-
80
-
81
-
82
-
83
-
84
-
85
-
86
-
87
-
88
-
89
-
90
-
91
-
92
-
93
-
94
-
95
-
96
-
97
-
98
-
99
-
100
-
101
-
102
-
103
-
104
-
105
-
106
-
107
-
108
-
109
-
110
-
111
-
112
-
113
-
114
-
115
-
116
-
117
-
118
-
119
-
120
-
121
-
122
-
123
-
124
-
125
-
126
-
127
-
128
-
129
-
130
-
131
-
132
-
133
-
134
-
135
-
136
-
137
-
138
-
139
-
140
-
141
-
142
-
143
-
144
-
145
-
146
-
147
-
148
-
149
-
150
-
151
-
152
-
153
-
154
-
155
-
156
-
157
-
158
-
159
-
160
-
161
-
162
-
163
-
164
-
165
-
166
-
167
-
168
-
169
-
170
-
171
-
172
-
173
-
174
-
175
-
176
-
177
-
178
-
179
-
180
-
181
-
182
-
183
-
184
-
185
-
186
-
187
-
188
-
189
-
190
-
191
-
192
-
193
-
194
-
195
-
196
-
197
-
198
-
199
-
200
-
201
-
202
-
203
-
204
-
205
-
206
-
207
-
208
-
209
-
210
-
211
-
212
-
213
-
214
-
215
-
216
-
217
-
218
-
219
-
220
-
221
-
222
-
223
-
224
-
225
-
226
-
227
-
228
-
229
-
230
-
231
-
232
-
233
-
234
-
235
-
236
-
237
-
238
-
239
-
240
-
241
-
242
-
243
-
244
-
245
-
246
-
247
-
248
-
249
-
250
-
251
-
252
-
253
-
254
-
255
-
256
-
257
-
258
-
259
-
260
-
261
-
262
-
263
-
264
-
265
-
266
-
267
-
268
-
269
-
270
-
271
-
272
-
273
-
274
-
275
-
276
-
277
-
278
-
279
-
280
-
281
-
282
-
283
-
284
-
285
-
286
-
287
-
288
-
 289
289 -
 290
290 -
 291
291 -
 292
292 -
 293
293 -
 294
294 -
 295
295 -
 296
296 -
 297
297 -
 298
298 -
 299
299 -
 300
300 -
 301
301 -
 302
302 -
 303
303 -
 304
304 -
 305
305 -
 306
306 -
 307
307 -
 308
308 -
 309
309 -
310
-
311
-
312
-
313
-
314
-
315
-
316
-
317
-
318
-
319
-
320
-
321
-
322
-
323
-
324
-
325
-
326
-
327
-
328
-
329
-
330
-
331
-
332
-
333
-
334
-
335
-
336
-
337
-
338
-
339
-
340
-
341
-
342
-
343
-
344
-
345
-
346
-
347
-
348
-
349
-
350
-
351
-
352
-
353
-
354
-
355
-
356
-
357
-
358
-
359
-
360
-
361
-
362
-
363
-
364
-
365
-
366
-
367
-
368
-
369
-
370
-
371
-
372
-
373
-
374
 |
 |

FIAT S.P.A.
STATUTORY
FINANCIAL
STATEMENTS AT
31 DECEMBER
2009
NOTES
298
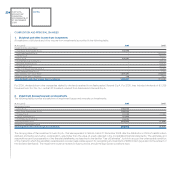
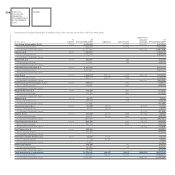
Following is a breakdown of financial income:
(€ thousand) 2009 2008
Financial income from Group companies:
Interest income from Fiat Finance S.p.A. current account 3,427 25,924
Interest income from Fiat Finance S.p.A. loans - 7,540
Commission income from sureties and personal guarantees 5,440 3,828
Other financial income 63 48
Total financial income from Group companies 8,930 37,340
Financial income from third parties:
Interest income on bank and other deposits 9 9
Interest income on tax credits 5,134 6,273
Total financial income from third parties 5,143 6,282
Exchange losses/(income) 117 74
Total financial income 14,190 43,696
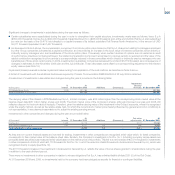
Following is a breakdown of financial expense:
(€ thousand)
2009 2008
Financial expense to Group companies:
Interest expense to Fiat Finance S.p.A. current account 598 1,659
Interest expense to Fiat Finance S.p.A. loans 124,590 171,593
Commissions and other charges payable to Fiat Netherlands Holding N.V. 6,255 11,369
Fiat Finance S.p.A. and Fidis S.p.A. service commissions 98 95
Interest and financial expense to other Group companies 266 323
Total financial expense to Group companies 131,807 185,039
Financial expense to third parties:
Interest expense and charges for the sale of receivables 8,778 13,191
Financial expense for employee benefits 1,084 1,008
Other third party interest and financial expense 3,204 3,301
Total financial expense to third parties 13,066 17,500
Total financial expense 144,873 202,539
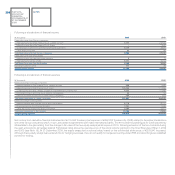
Net income from derivative financial instruments of €116,992 thousand (net expense of €262,832 thousand for 2008) related to derivative transactions
with other Group companies which, in turn, are parties to agreements with major international banks. The €116,992 thousand figure for 2009 was entirely
attributable to the gain arising from the change in fair value of the two equity swaps (which expire in 2010, following extension of the two contracts during
the year) entered into as hedges against Fiat shares rising above the exercise price of the stock options granted to the Chief Executive Officer in 2004
and 2006 (see Note 19). At 31 December 2009, the equity swaps had a notional value, based on the contractual strike price, of €203,941 thousand.
Although these equity swaps were entered into for hedging purposes, they do not qualify for hedge accounting under IFRS and accordingly are classified
as held for trading.