Chrysler 2009 Annual Report Download - page 278
Download and view the complete annual report
Please find page 278 of the 2009 Chrysler annual report below. You can navigate through the pages in the report by either clicking on the pages listed below, or by using the keyword search tool below to find specific information within the annual report.-
 1
1 -
2
-
3
-
4
-
5
-
6
-
7
-
8
-
9
-
10
-
11
-
12
-
13
-
14
-
15
-
16
-
17
-
18
-
19
-
20
-
21
-
22
-
23
-
24
-
25
-
26
-
27
-
28
-
29
-
30
-
31
-
32
-
33
-
34
-
35
-
36
-
37
-
38
-
39
-
40
-
41
-
42
-
43
-
44
-
45
-
46
-
47
-
48
-
49
-
50
-
51
-
52
-
53
-
54
-
55
-
56
-
57
-
58
-
59
-
60
-
61
-
62
-
63
-
64
-
65
-
66
-
67
-
68
-
69
-
70
-
71
-
72
-
73
-
74
-
75
-
76
-
77
-
78
-
79
-
80
-
81
-
82
-
83
-
84
-
85
-
86
-
87
-
88
-
89
-
90
-
91
-
92
-
93
-
94
-
95
-
96
-
97
-
98
-
99
-
100
-
101
-
102
-
103
-
104
-
105
-
106
-
107
-
108
-
109
-
110
-
111
-
112
-
113
-
114
-
115
-
116
-
117
-
118
-
119
-
120
-
121
-
122
-
123
-
124
-
125
-
126
-
127
-
128
-
129
-
130
-
131
-
132
-
133
-
134
-
135
-
136
-
137
-
138
-
139
-
140
-
141
-
142
-
143
-
144
-
145
-
146
-
147
-
148
-
149
-
150
-
151
-
152
-
153
-
154
-
155
-
156
-
157
-
158
-
159
-
160
-
161
-
162
-
163
-
164
-
165
-
166
-
167
-
168
-
169
-
170
-
171
-
172
-
173
-
174
-
175
-
176
-
177
-
178
-
179
-
180
-
181
-
182
-
183
-
184
-
185
-
186
-
187
-
188
-
189
-
190
-
191
-
192
-
193
-
194
-
195
-
196
-
197
-
198
-
199
-
200
-
201
-
202
-
203
-
204
-
205
-
206
-
207
-
208
-
209
-
210
-
211
-
212
-
213
-
214
-
215
-
216
-
217
-
218
-
219
-
220
-
221
-
222
-
223
-
224
-
225
-
226
-
227
-
228
-
229
-
230
-
231
-
232
-
233
-
234
-
235
-
236
-
237
-
238
-
239
-
240
-
241
-
242
-
243
-
244
-
245
-
246
-
247
-
248
-
249
-
250
-
251
-
252
-
253
-
254
-
255
-
256
-
257
-
258
-
259
-
260
-
261
-
262
-
263
-
264
-
265
-
266
-
267
-
 268
268 -
 269
269 -
 270
270 -
 271
271 -
 272
272 -
 273
273 -
 274
274 -
 275
275 -
 276
276 -
 277
277 -
 278
278 -
 279
279 -
 280
280 -
 281
281 -
 282
282 -
 283
283 -
 284
284 -
 285
285 -
 286
286 -
 287
287 -
 288
288 -
289
-
290
-
291
-
292
-
293
-
294
-
295
-
296
-
297
-
298
-
299
-
300
-
301
-
302
-
303
-
304
-
305
-
306
-
307
-
308
-
309
-
310
-
311
-
312
-
313
-
314
-
315
-
316
-
317
-
318
-
319
-
320
-
321
-
322
-
323
-
324
-
325
-
326
-
327
-
328
-
329
-
330
-
331
-
332
-
333
-
334
-
335
-
336
-
337
-
338
-
339
-
340
-
341
-
342
-
343
-
344
-
345
-
346
-
347
-
348
-
349
-
350
-
351
-
352
-
353
-
354
-
355
-
356
-
357
-
358
-
359
-
360
-
361
-
362
-
363
-
364
-
365
-
366
-
367
-
368
-
369
-
370
-
371
-
372
-
373
-
374
 |
 |

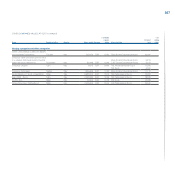
277
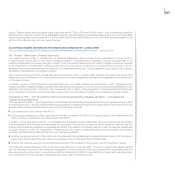
At of which At of which
31 December related parties 31 December related parties
(€ thousand) Note 2009 (Note 30) 2008 (Note 30)
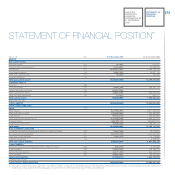
ASSETS
Non-current assets
Intangible assets (10) 313 375
Property, plant and equipment (11) 31,445 33,024
Investments (12) 13,990,570 13,969,094 14,444,736 14,426,446
Other financial assets (13) 26,887 16,782 20,637 10,531
Other non-current assets (14) 203 244
Deferred tax assets (9) - -
Total non-current assets 14,049,418 14,499,016
Current assets
Inventory (26) - -
Trade receivables (15) 60,015 7,152 185,292 53,983
Current financial receivables (16) 646,074 646,074 -
Other current receivables (17) 198,923 121,910 905,058 327,087
Cash and cash equivalents (18) 474 495
Total current assets 905,486 1,090,845
Assets held for sale
TOTAL ASSETS 14,954,904 15,589,861
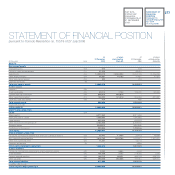
EQUITY AND LIABILITIES
Equity (19)
Share capital 6,377,263 6,377,263
Additional paid-in capital 1,540,885 1,540,885
Legal reserve 699,460 639,503
Other reserves and retained profit 4,185,828 3,069,500
Treasury shares (656,553) (656,553)
Profit/(loss) for the period 339,964 1,199,146
Total equity 12,486,847 12,169,744
NON-CURRENT LIABILITIES
Provisions for employee benefits and other non-current provisions (20) 25,441 17,444 26,418 16,848
Non-current financial liabilities (21) 1,816,782 1,816,782 1,810,531 1,810,531
Other non-current liabilities (22) 14,351 15,115
Deferred tax liabilities (9) - 5,858
TOTAL NON-CURRENT LIABILITIES 1,856,574 1,857,922
Current liabilities
Provisions for employee benefits and other current provisions (23) 8,464 5,664 6,346
Trade payables (24) 156,249 3,757 218,235 2,316
Current financial liabilities (25) 156,712 96,321 553,133 238,976
Other payables (26) 290,058 260,806 784,481 548,611
Total current liabilities 611,483 1,562,195
Liabilities held for sale
TOTAL EQUITY AND LIABILITIES 14,954,904 15,589,861
STATEMENT OF FINANCIAL POSITION
pursuant to Consob Resolution no. 15519 of 27 July 2006
FIAT S.P.A.
STATUTORY
FINANCIAL
STATEMENTS AT
31 DECEMBER
2009
STATEMENT OF
FINANCIAL
POSITION
PURSUANT TO
CONSOB RESOLUTION
NO. 15519
OF 27 JULY 2006