Chrysler 2009 Annual Report Download - page 68
Download and view the complete annual report
Please find page 68 of the 2009 Chrysler annual report below. You can navigate through the pages in the report by either clicking on the pages listed below, or by using the keyword search tool below to find specific information within the annual report.-
 1
1 -
2
-
3
-
4
-
5
-
6
-
7
-
8
-
9
-
10
-
11
-
12
-
13
-
14
-
15
-
16
-
17
-
18
-
19
-
20
-
21
-
22
-
23
-
24
-
25
-
26
-
27
-
28
-
29
-
30
-
31
-
32
-
33
-
34
-
35
-
36
-
37
-
38
-
39
-
40
-
41
-
42
-
43
-
44
-
45
-
46
-
47
-
48
-
49
-
50
-
51
-
52
-
53
-
54
-
55
-
56
-
57
-
 58
58 -
 59
59 -
 60
60 -
 61
61 -
 62
62 -
 63
63 -
 64
64 -
 65
65 -
 66
66 -
 67
67 -
 68
68 -
 69
69 -
 70
70 -
 71
71 -
 72
72 -
 73
73 -
 74
74 -
 75
75 -
 76
76 -
 77
77 -
 78
78 -
79
-
80
-
81
-
82
-
83
-
84
-
85
-
86
-
87
-
88
-
89
-
90
-
91
-
92
-
93
-
94
-
95
-
96
-
97
-
98
-
99
-
100
-
101
-
102
-
103
-
104
-
105
-
106
-
107
-
108
-
109
-
110
-
111
-
112
-
113
-
114
-
115
-
116
-
117
-
118
-
119
-
120
-
121
-
122
-
123
-
124
-
125
-
126
-
127
-
128
-
129
-
130
-
131
-
132
-
133
-
134
-
135
-
136
-
137
-
138
-
139
-
140
-
141
-
142
-
143
-
144
-
145
-
146
-
147
-
148
-
149
-
150
-
151
-
152
-
153
-
154
-
155
-
156
-
157
-
158
-
159
-
160
-
161
-
162
-
163
-
164
-
165
-
166
-
167
-
168
-
169
-
170
-
171
-
172
-
173
-
174
-
175
-
176
-
177
-
178
-
179
-
180
-
181
-
182
-
183
-
184
-
185
-
186
-
187
-
188
-
189
-
190
-
191
-
192
-
193
-
194
-
195
-
196
-
197
-
198
-
199
-
200
-
201
-
202
-
203
-
204
-
205
-
206
-
207
-
208
-
209
-
210
-
211
-
212
-
213
-
214
-
215
-
216
-
217
-
218
-
219
-
220
-
221
-
222
-
223
-
224
-
225
-
226
-
227
-
228
-
229
-
230
-
231
-
232
-
233
-
234
-
235
-
236
-
237
-
238
-
239
-
240
-
241
-
242
-
243
-
244
-
245
-
246
-
247
-
248
-
249
-
250
-
251
-
252
-
253
-
254
-
255
-
256
-
257
-
258
-
259
-
260
-
261
-
262
-
263
-
264
-
265
-
266
-
267
-
268
-
269
-
270
-
271
-
272
-
273
-
274
-
275
-
276
-
277
-
278
-
279
-
280
-
281
-
282
-
283
-
284
-
285
-
286
-
287
-
288
-
289
-
290
-
291
-
292
-
293
-
294
-
295
-
296
-
297
-
298
-
299
-
300
-
301
-
302
-
303
-
304
-
305
-
306
-
307
-
308
-
309
-
310
-
311
-
312
-
313
-
314
-
315
-
316
-
317
-
318
-
319
-
320
-
321
-
322
-
323
-
324
-
325
-
326
-
327
-
328
-
329
-
330
-
331
-
332
-
333
-
334
-
335
-
336
-
337
-
338
-
339
-
340
-
341
-
342
-
343
-
344
-
345
-
346
-
347
-
348
-
349
-
350
-
351
-
352
-
353
-
354
-
355
-
356
-
357
-
358
-
359
-
360
-
361
-
362
-
363
-
364
-
365
-
366
-
367
-
368
-
369
-
370
-
371
-
372
-
373
-
374
 |
 |

67
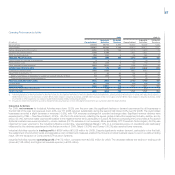
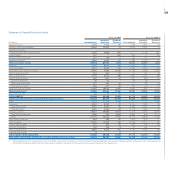
Operating Performance by Activity
2009 2008 (*)
Industrial Financial Industrial Financial
(€ million)
Consolidated Activities Services Consolidated Activities Services
Net revenues 50,102 48,917 1,467 59,564 58,435 1,535
Cost of sales 43,261 42,404 1,139 49,612 48,971 1,047
Selling, general and administrative 4,296 4,133 163 5,075 4,899 176
Research and development 1,398 1,398 - 1,497 1,497 -
Other income/(expense) (89) (92) 3 (18) (30) 12
TRADING PROFIT/(LOSS) 1,058 890 168 3,362 3,038 324
Gains/(losses) on disposal of investments 4 4 - 20 16 4
Restructuring costs 312 310 2 165 160 5
Other unusual income/(expense) (391) (412) 21 (245) (242) (3)
OPERATING PROFIT/(LOSS) 359 172 187 2,972 2,652 320
Financial income/(expense) (753) (753) - (947) (947) -
Result from investments: (**) 27 (6) 33 162 84 78
Share of profit/(loss) of investees accounted for using the equity method 18 (13) 31 133 54 79
Other income/(expense) from investments 9 7 2 29 30 (1)
PROFIT/(LOSS) BEFORE TAXES (367) (587) 220 2,187 1,789 398
Income taxes 481 435 46 466 368 98
PROFIT/(LOSS) (848) (1,022) 174 1,721 1,421 300
Result from intersegment investments - 174 (16) - 300 4
PROFIT/(LOSS) (848) (848) 158 1,721 1,721 304
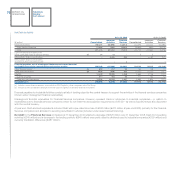
(*) Following adoption of the improvement to IAS 16 in 2009, as described in the Notes to the Consolidated Financial Statements, previously reported amounts for 2008 were adjusted as follows: a
€184 million increase in net revenues (of which €126 million relates to Industrial Activities), a €189 million increase in the cost of sales (of which €131 million relates to Industrial Activities). Other
income (net of other expenses) was reduced by €5 million (related entirely to Industrial Activities).
(**) Includes income from investments as well as impairment (losses)/reversals on non-intersegment investments accounted for under the equity method.
Industrial Activities
For 2009, net revenues for Industrial Activities were down 16.3% over the prior year: the significant declines in demand experienced by all businesses in
the first half of the year (net revenues down 24% over H1 2008) reduced substantially during the second half (down 6.6% over H2 2008). The Automobiles
businesses recorded a slight decrease in revenues (-3.6%), with FGA revenues unchanged at constant exchange rates. Significant revenue declines were
experienced by CNH – Case New Holland (-22.4%; -26.4% in US dollar terms), reflecting the severe global construction equipment industry decline, and by
Iveco (-35.0%), with lower sales volumes attributable to the negative market trend, particularly in Europe. All Sectors comprising the Components & Production
Systems business area were impacted by volume declines (25.1% decrease in net revenues). More specifically, FPT Powertrain Technologies (-29.3%) was
impacted by lower volumes for the Industrial & Marine product line, whereas Magneti Marelli (-14% on a comparable scope of operations) was particularly
influenced by the declines experienced in the first six months of 2009. Teksid (-30.9%) and Comau (-35.2%) also reported lower revenues.
Industrial Activities reported a trading profit of €890 million (€3,038 million for 2008). Despite significantly weaker demand, particularly in the first half,
the realignment of production levels and aggressive cost containment measures enabled the Group’s principal business areas to report a positive trading
result, with the exception of Components & Production Systems.
Industrial Activities reported operating profit of €172 million, compared with €2,652 million for 2008. The decrease reflects the decline in trading profit
(down €2,148 million) and higher net unusual expense (+€332 million).