Chrysler 2009 Annual Report Download - page 205
Download and view the complete annual report
Please find page 205 of the 2009 Chrysler annual report below. You can navigate through the pages in the report by either clicking on the pages listed below, or by using the keyword search tool below to find specific information within the annual report.-
 1
1 -
2
-
3
-
4
-
5
-
6
-
7
-
8
-
9
-
10
-
11
-
12
-
13
-
14
-
15
-
16
-
17
-
18
-
19
-
20
-
21
-
22
-
23
-
24
-
25
-
26
-
27
-
28
-
29
-
30
-
31
-
32
-
33
-
34
-
35
-
36
-
37
-
38
-
39
-
40
-
41
-
42
-
43
-
44
-
45
-
46
-
47
-
48
-
49
-
50
-
51
-
52
-
53
-
54
-
55
-
56
-
57
-
58
-
59
-
60
-
61
-
62
-
63
-
64
-
65
-
66
-
67
-
68
-
69
-
70
-
71
-
72
-
73
-
74
-
75
-
76
-
77
-
78
-
79
-
80
-
81
-
82
-
83
-
84
-
85
-
86
-
87
-
88
-
89
-
90
-
91
-
92
-
93
-
94
-
95
-
96
-
97
-
98
-
99
-
100
-
101
-
102
-
103
-
104
-
105
-
106
-
107
-
108
-
109
-
110
-
111
-
112
-
113
-
114
-
115
-
116
-
117
-
118
-
119
-
120
-
121
-
122
-
123
-
124
-
125
-
126
-
127
-
128
-
129
-
130
-
131
-
132
-
133
-
134
-
135
-
136
-
137
-
138
-
139
-
140
-
141
-
142
-
143
-
144
-
145
-
146
-
147
-
148
-
149
-
150
-
151
-
152
-
153
-
154
-
155
-
156
-
157
-
158
-
159
-
160
-
161
-
162
-
163
-
164
-
165
-
166
-
167
-
168
-
169
-
170
-
171
-
172
-
173
-
174
-
175
-
176
-
177
-
178
-
179
-
180
-
181
-
182
-
183
-
184
-
185
-
186
-
187
-
188
-
189
-
190
-
191
-
192
-
193
-
194
-
 195
195 -
 196
196 -
 197
197 -
 198
198 -
 199
199 -
 200
200 -
 201
201 -
 202
202 -
 203
203 -
 204
204 -
 205
205 -
 206
206 -
 207
207 -
 208
208 -
 209
209 -
 210
210 -
 211
211 -
 212
212 -
 213
213 -
 214
214 -
 215
215 -
216
-
217
-
218
-
219
-
220
-
221
-
222
-
223
-
224
-
225
-
226
-
227
-
228
-
229
-
230
-
231
-
232
-
233
-
234
-
235
-
236
-
237
-
238
-
239
-
240
-
241
-
242
-
243
-
244
-
245
-
246
-
247
-
248
-
249
-
250
-
251
-
252
-
253
-
254
-
255
-
256
-
257
-
258
-
259
-
260
-
261
-
262
-
263
-
264
-
265
-
266
-
267
-
268
-
269
-
270
-
271
-
272
-
273
-
274
-
275
-
276
-
277
-
278
-
279
-
280
-
281
-
282
-
283
-
284
-
285
-
286
-
287
-
288
-
289
-
290
-
291
-
292
-
293
-
294
-
295
-
296
-
297
-
298
-
299
-
300
-
301
-
302
-
303
-
304
-
305
-
306
-
307
-
308
-
309
-
310
-
311
-
312
-
313
-
314
-
315
-
316
-
317
-
318
-
319
-
320
-
321
-
322
-
323
-
324
-
325
-
326
-
327
-
328
-
329
-
330
-
331
-
332
-
333
-
334
-
335
-
336
-
337
-
338
-
339
-
340
-
341
-
342
-
343
-
344
-
345
-
346
-
347
-
348
-
349
-
350
-
351
-
352
-
353
-
354
-
355
-
356
-
357
-
358
-
359
-
360
-
361
-
362
-
363
-
364
-
365
-
366
-
367
-
368
-
369
-
370
-
371
-
372
-
373
-
374
 |
 |

204 FIAT GROUP
CONSOLIDATED
FINANCIAL
STATEMENTS
AT 31 DECEMBER
2009
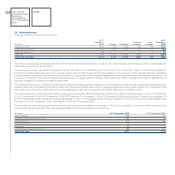
NOTES
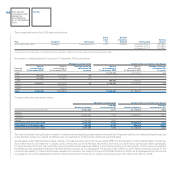
Change in
the scope of
At 31 December consolidation and At 31 December
(€ million) 2008 Provision Utilisation other changes 2009
Other provisions for employees 437 242 (260) (90) 329
Other long-term employee benefits 170 17 (21) 3 169
Total 607 259 (281) (87) 498
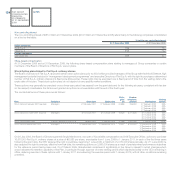
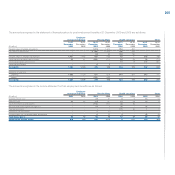
Post-employment benefits and other long-term employee benefits are calculated on the basis of the following assumptions:
At 31 December 2009 At 31 December 2008
(in %) Italy USA UK Other Italy USA UK Other
Discount rate 5.02 5.5 5.75 5.5 5.1 6.1 6.5 6.0
Future salary increase 4.02 n/a 3.5 3 4.65 n/a 3.1 2.5-3.75
Inflation rate 2.00 n/a 3.5 2 2.0 n/a 3.1 2.0
Weighted average, initial healthcare cost trend rate n/a 9 n/a n/a n/a 9 n/a n/a
Weighted average, ultimate healthcare cost trend rate n/a 5 n/a n/a n/a 5 n/a n/a
Expected return on plan assets n/a 8 7 n/a n/a 7.75-8 7.0 n/a
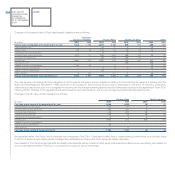
Assumed discount rates are used in measurements of pension and postretirement benefit obligations and interest cost components of net periodic cost.
The Group selects its assumed discount rates based on the consideration of equivalent yields on high-quality fixed income investments at the measurement
date.
The assumed health care trend rate represents the rate at which health care costs are assumed to increase. Rates are determined based on the Agricultural
and Construction Equipment Sector specific experience and various trend factors including general and health care sector-specific inflation projections
from the United States Department of Health and Human Services Health Care Financing Administration. The initial trend is a short-term assumption based
on recent experience and prevailing market conditions. The ultimate trend is a long-term assumption of health care cost inflation based, among others on
general inflation, incremental medical inflation, technology, new medicine, aging population and a changing mix of medical services.
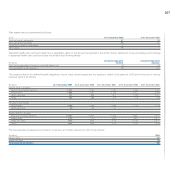
The expected long-term rate of return on plan assets reflects management’s expectations on long-term average rates of return on funds invested to provide
for benefits included in the projected benefit obligations. The expected return is based on the outlook for inflation, fixed income returns and equity returns,
while also considering asset allocation and investment strategy, premiums for active management to the extent asset classes are actively managed and
plan expenses. Return patterns and correlations, consensus return forecasts and other relevant financial factors are analysed to check for reasonability and
appropriateness.