SunTrust 2007 Annual Report Download - page 93
Download and view the complete annual report
Please find page 93 of the 2007 SunTrust annual report below. You can navigate through the pages in the report by either clicking on the pages listed below, or by using the keyword search tool below to find specific information within the annual report.-
 1
1 -
2
-
3
-
4
-
5
-
6
-
7
-
8
-
9
-
10
-
11
-
12
-
13
-
14
-
15
-
16
-
17
-
18
-
19
-
20
-
21
-
22
-
23
-
24
-
25
-
26
-
27
-
28
-
29
-
30
-
31
-
32
-
33
-
34
-
35
-
36
-
37
-
38
-
39
-
40
-
41
-
42
-
43
-
44
-
45
-
46
-
47
-
48
-
49
-
50
-
51
-
52
-
53
-
54
-
55
-
56
-
57
-
58
-
59
-
60
-
61
-
62
-
63
-
64
-
65
-
66
-
67
-
68
-
69
-
70
-
71
-
72
-
73
-
74
-
75
-
76
-
77
-
78
-
79
-
80
-
81
-
82
-
 83
83 -
 84
84 -
 85
85 -
 86
86 -
 87
87 -
 88
88 -
 89
89 -
 90
90 -
 91
91 -
 92
92 -
 93
93 -
 94
94 -
 95
95 -
 96
96 -
 97
97 -
 98
98 -
 99
99 -
 100
100 -
 101
101 -
 102
102 -
 103
103 -
104
-
105
-
106
-
107
-
108
-
109
-
110
-
111
-
112
-
113
-
114
-
115
-
116
-
117
-
118
-
119
-
120
-
121
-
122
-
123
-
124
-
125
-
126
-
127
-
128
-
129
-
130
-
131
-
132
-
133
-
134
-
135
-
136
-
137
-
138
-
139
-
140
-
141
-
142
-
143
-
144
-
145
-
146
-
147
-
148
-
149
-
150
-
151
-
152
-
153
-
154
-
155
-
156
-
157
-
158
-
159
-
160
-
161
-
162
-
163
-
164
-
165
-
166
-
167
-
168
 |
 |

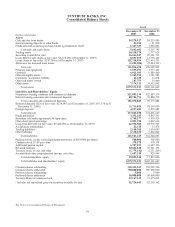
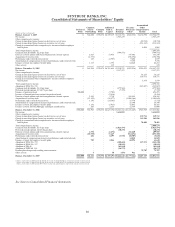
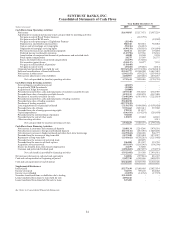
SUNTRUST BANKS, INC.
Consolidated Statements of Cash Flows
Year Ended December 31
(Dollars in thousands) 2007 2006 2005
Cash Flows from Operating Activities:
Net income $1,634,015 $2,117,471 $1,987,239
Adjustments to reconcile net income to net cash provided by operating activities:
Net gain on sale of Bond Trustee business -(112,759) -
Net gain on sale of RCM assets -- (23,382)
Net gain on sale upon merger of Lighthouse Partners (32,340) --
Depreciation, amortization and accretion 802,342 810,881 783,084
Gain on sale of mortgage servicing rights (51,236) (66,283) -
Origination of mortgage servicing rights (639,158) (503,801) (341,694)
Provisions for loan losses and foreclosed property 683,114 265,609 179,294
Deferred income tax (benefit) provision (147,758) 107,966 178,318
Amortization of compensation element of performance and restricted stock 34,820 18,340 9,190
Stock option compensation 24,275 25,969 26,375
Excess tax benefits from stock-based compensation (11,259) (33,258) -
Net securities (gains) losses (243,117) 50,477 7,155
Net gain on sale/leaseback of premises (118,840) --
Net gain on sale of assets (25,268) (49,285) (4,411)
Originated and purchased loans held for sale (52,762,349) (47,374,700) (38,582,413)
Sales and securitizations of loans held for sale 55,241,777 49,308,909 31,467,023
Net increase in other assets (1,961,352) (470,225) (1,874,683)
Net increase (decrease) in other liabilities 1,284,967 (207,285) 1,470,187
Net cash provided by (used in) operating activities 3,712,633 3,888,026 (4,718,718)
Cash Flows from Investing Activities:
Seix contingent consideration payout (42,287) --
Acquistion of TBK Investments (19,200) --
Acquistion of Inlign Investments (13,000) --
Proceeds from maturities, calls and repayments of securities available for sale 1,073,340 3,914,243 4,783,789
Proceeds from sales of securities available for sale 1,199,231 4,945,870 4,367,480
Purchases of securities available for sale (7,640,289) (6,931,905) (7,221,819)
Proceeds from maturities, calls and repayments of trading securities 11,896,617 --
Proceeds from sales of trading securities 19,240,250 --
Purchases of trading securities (22,717,152) --
Loan originations net of principal collected (7,158,570) (9,490,800) (14,070,420)
Proceeds from sale of loans 5,721,662 2,235,011 337,902
Proceeds from sale of mortgage servicing rights 270,215 211,157 -
Capital expenditures (186,431) (334,254) (201,650)
Proceeds from the sale/leaseback of premises 764,368 --
Proceeds from the sale of other assets 145,871 45,203 42,841
Other investing activities -- 5,311
Net cash provided by (used in) investing activities 2,534,625 (5,405,475) (11,956,566)
Cash Flows from Financing Activities:
Net increase in consumer and commercial deposits 2,100,134 2,214,246 5,470,301
Net (decrease) increase in foreign and brokered deposits (8,273,116) (235,055) 13,229,240
Net (decrease) increase in funds purchased and other short-term borrowings (1,679,833) 1,568,496 906,777
Proceeds from the issuance of long-term debt 5,197,020 2,925,024 1,974,987
Repayment of long-term debt (1,543,612) (4,702,283) (3,233,688)
Proceeds from the issuance of preferred stock -492,295 -
Proceeds from the exercise of stock options 186,000 215,947 135,701
Acquisition of treasury stock (853,385) (1,105,043) (196,396)
Excess tax benefits from stock-based compensation 11,259 33,258 -
Common and preferred dividends paid (1,056,869) (887,297) (794,971)
Net cash (used in) provided by financing activities (5,912,402) 519,588 17,491,951
Net increase (decrease) in cash and cash equivalents 334,856 (997,861) 816,667
Cash and cash equivalents at beginning of period 5,307,745 6,305,606 5,488,939
Cash and cash equivalents at end of period $5,642,601 $5,307,745 $6,305,606
Supplemental Disclosures:
Interest paid $5,277,639 $5,088,403 $3,027,834
Income taxes paid 724,351 709,168 684,042
Income taxes refunded (13,859) (14,762) (17,593)
Securities transferred from available for sale to trading 15,143,109 --
Loans transferred from loans to loans held for sale 4,054,246 --
Loans transferred from loans held for sale to loans 837,401 --
See Notes to Consolidated Financial Statements.
81