SunTrust 2007 Annual Report Download - page 75
Download and view the complete annual report
Please find page 75 of the 2007 SunTrust annual report below. You can navigate through the pages in the report by either clicking on the pages listed below, or by using the keyword search tool below to find specific information within the annual report.-
 1
1 -
2
-
3
-
4
-
5
-
6
-
7
-
8
-
9
-
10
-
11
-
12
-
13
-
14
-
15
-
16
-
17
-
18
-
19
-
20
-
21
-
22
-
23
-
24
-
25
-
26
-
27
-
28
-
29
-
30
-
31
-
32
-
33
-
34
-
35
-
36
-
37
-
38
-
39
-
40
-
41
-
42
-
43
-
44
-
45
-
46
-
47
-
48
-
49
-
50
-
51
-
52
-
53
-
54
-
55
-
56
-
57
-
58
-
59
-
60
-
61
-
62
-
63
-
64
-
 65
65 -
 66
66 -
 67
67 -
 68
68 -
 69
69 -
 70
70 -
 71
71 -
 72
72 -
 73
73 -
 74
74 -
 75
75 -
 76
76 -
 77
77 -
 78
78 -
 79
79 -
 80
80 -
 81
81 -
 82
82 -
 83
83 -
 84
84 -
 85
85 -
86
-
87
-
88
-
89
-
90
-
91
-
92
-
93
-
94
-
95
-
96
-
97
-
98
-
99
-
100
-
101
-
102
-
103
-
104
-
105
-
106
-
107
-
108
-
109
-
110
-
111
-
112
-
113
-
114
-
115
-
116
-
117
-
118
-
119
-
120
-
121
-
122
-
123
-
124
-
125
-
126
-
127
-
128
-
129
-
130
-
131
-
132
-
133
-
134
-
135
-
136
-
137
-
138
-
139
-
140
-
141
-
142
-
143
-
144
-
145
-
146
-
147
-
148
-
149
-
150
-
151
-
152
-
153
-
154
-
155
-
156
-
157
-
158
-
159
-
160
-
161
-
162
-
163
-
164
-
165
-
166
-
167
-
168
 |
 |

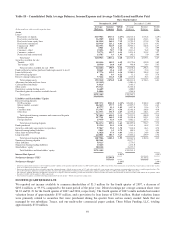
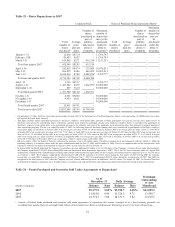
The following analysis details the operating results for each line of business for the twelve months ended December 31,
2007, 2006 and 2005. Prior periods have been restated to conform to the current period’s presentation.
Table 19 – Net Income by Segment
The following table for our reportable business segments compares net income for the twelve months ended December 31,
2007 to the same period in 2006 and 2005:
Twelve Months Ended December 31
(Dollars in millions) 2007 2006 2005
Retail $602.1 $715.6 $640.2
Commercial 373.1 424.5 372.3
Corporate and Investment Banking 45.6 190.2 248.5
Mortgage 7.9 245.7 179.9
Wealth and Investment Management 84.9 289.2 218.4
Corporate Other and Treasury 224.0 23.9 67.5
Reconciling Items 296.4 228.5 260.5
The following table for our reportable business segments compares average loans and average deposits for the twelve months
ended December 31, 2007 to the same period in 2006 and 2005:
Table 20 – Average Loans and Deposits by Segment
Twelve Months Ended December 31
Average Loans Average Deposits
(Dollars in millions) 2007 2006 2005 2007 2006 2005
Retail $31,713 $30,888 $30,442 $68,236 $68,998 $65,239
Commercial 32,980 32,533 30,866 14,408 13,799 13,433
Corporate and Investment Banking 15,990 16,410 15,148 3,574 3,105 3,265
Mortgage 30,805 31,233 24,206 2,137 1,811 1,654
Wealth and Investment Management 7,965 8,135 7,810 9,781 9,477 9,528
Corporate Other and Treasury 661 473 327 21,764 26,601 17,436
BUSINESS SEGMENT RESULTS
Retail
Retail’s net income for the twelve months ended December 31, 2007, was $602.1 million, a decrease of $113.4 million, or
15.9%, compared to the same period in 2006. The decrease was primarily the result of higher provision expense and lower
net interest income, partially offset by higher noninterest income.
Net interest income decreased $58.2 million, or 2.5%, driven by a shift in deposit mix and compressed spreads as deposit
competition and the interest rate environment encouraged customers to migrate into higher yielding interest bearing accounts.
Average deposits decreased $761.5 million, or 1.1% year over year, as increases in certain higher-cost NOW account
products and time deposits were offset by declines in demand deposits and certain lower-cost money market accounts.
Positively impacting net interest income was an $824.8 million, or 2.7%, increase in average loans driven by 4.4% and
10.5% growth in home equity and commercial loans, respectively. These increases were partially offset by a 4.4% decrease
in indirect auto loans and a 14.0% decrease in direct installment loans.
Provision for loan losses increased $160.6 million over 2006. The provision increase was most pronounced in home equity,
indirect auto and commercial loans, reflecting the negative impact from the current deterioration in certain segments of the
consumer portfolio, primarily related to the residential real estate market.
Total noninterest income for 2007 increased $53.0 million, or 5.0%, over 2006 levels. The increase was due to a $45.8
million, or 7.7%, increase in service charges on deposit accounts driven by higher consumer and business fees primarily due
to higher NSF fees. Interchange income also grew due to increased transaction volume. These increases were partially offset
by a decrease in gains on sales of student loans.
63