SunTrust 2007 Annual Report Download - page 108
Download and view the complete annual report
Please find page 108 of the 2007 SunTrust annual report below. You can navigate through the pages in the report by either clicking on the pages listed below, or by using the keyword search tool below to find specific information within the annual report.-
 1
1 -
2
-
3
-
4
-
5
-
6
-
7
-
8
-
9
-
10
-
11
-
12
-
13
-
14
-
15
-
16
-
17
-
18
-
19
-
20
-
21
-
22
-
23
-
24
-
25
-
26
-
27
-
28
-
29
-
30
-
31
-
32
-
33
-
34
-
35
-
36
-
37
-
38
-
39
-
40
-
41
-
42
-
43
-
44
-
45
-
46
-
47
-
48
-
49
-
50
-
51
-
52
-
53
-
54
-
55
-
56
-
57
-
58
-
59
-
60
-
61
-
62
-
63
-
64
-
65
-
66
-
67
-
68
-
69
-
70
-
71
-
72
-
73
-
74
-
75
-
76
-
77
-
78
-
79
-
80
-
81
-
82
-
83
-
84
-
85
-
86
-
87
-
88
-
89
-
90
-
91
-
92
-
93
-
94
-
95
-
96
-
97
-
 98
98 -
 99
99 -
 100
100 -
 101
101 -
 102
102 -
 103
103 -
 104
104 -
 105
105 -
 106
106 -
 107
107 -
 108
108 -
 109
109 -
 110
110 -
 111
111 -
 112
112 -
 113
113 -
 114
114 -
 115
115 -
 116
116 -
 117
117 -
 118
118 -
119
-
120
-
121
-
122
-
123
-
124
-
125
-
126
-
127
-
128
-
129
-
130
-
131
-
132
-
133
-
134
-
135
-
136
-
137
-
138
-
139
-
140
-
141
-
142
-
143
-
144
-
145
-
146
-
147
-
148
-
149
-
150
-
151
-
152
-
153
-
154
-
155
-
156
-
157
-
158
-
159
-
160
-
161
-
162
-
163
-
164
-
165
-
166
-
167
-
168
 |
 |

SUNTRUST BANKS, INC.
Notes to Consolidated Financial Statements (Continued)
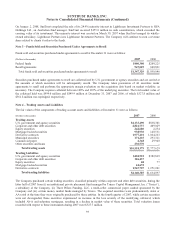
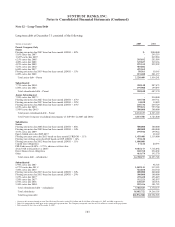
Note 6 – Loans
The composition of the Company’s loan portfolio at December 31 is shown in the following table:
(Dollars in millions) 2007 2006
Commercial $35,929.4 $34,613.9
Real estate:
Home equity lines 14,911.6 14,102.7
Construction 13,776.7 13,893.0
Residential mortgages 32,779.7 33,830.1
Commercial real estate 12,609.5 12,567.8
Consumer:
Direct 3,963.9 4,160.1
Indirect 7,494.1 7,936.0
Credit card 854.1 350.7
Total loans $122,319.0 $121,454.3
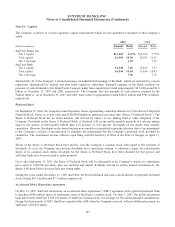
Total nonaccrual loans at December 31, 2007 and 2006 were $1,430.4 million and $503.8 million, respectively. The gross
amounts of interest income that would have been recorded in 2007, 2006, and 2005 on nonaccrual loans at December 31 of
each year, if all such loans had been accruing interest at their contractual rates, were $85.0 million, $41.6 million, and $28.3
million, while interest income actually recognized totaled $17.3 million, $16.6 million, and $13.2 million, respectively.
At December 31, 2007 and 2006, impaired loans amounted to $177.5 million and $101.0 million, respectively. At
December 31, 2007 and 2006, impaired loans requiring an allowance for loan losses were $145.2 million and $79.6 million,
respectively. Included in the allowance for loan and lease losses was $17.5 million and $17.4 million at December 31, 2007
and 2006, respectively, related to impaired loans. For the years ended December 31, 2007, 2006, and 2005, the average
recorded investment in impaired loans was $130.4 million, $131.7 million, and $191.6 million, respectively; and $8.6
million, $10.6 million, and $8.2 million, respectively, of interest income was recognized on loans while they were impaired.
At December 31, 2007 and 2006, accruing loans past due 90 days or more were $611.0 million and $351.5 million,
respectively.
During the fourth quarter of 2007, the Company transferred $837.4 million in loans held for sale to loans held for investment
in response to liquidity issues in the market with respect to these loans. In accordance with SFAS No. 65, “Accounting for
Certain Mortgage Banking Activities,” the loans were transferred at the lower of cost or market resulting in a write-down of
$27.2 million. At December 31, 2007 and December 31, 2006, $36.1 billion of loans and $35.0 billion of loans, respectively
were pledged as collateral for borrowings.
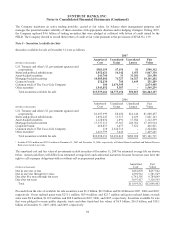
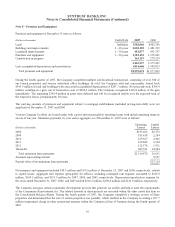
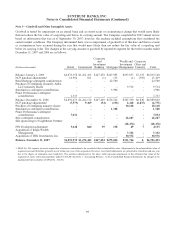
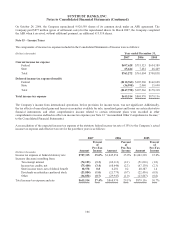
Note 7 – Allowance for Loan and Lease Losses
Activity in the allowance for loan and lease losses for the twelve months ended December 31 is summarized in the table
below:
(Dollars in thousands) 2007 2006 2005
Balance at beginning of year $1,044,521 $1,028,128 $1,050,024
Allowance associated with loans at fair value1(4,100) --
Provision for loan losses 664,922 262,536 176,886
Loan charge-offs (514,348) (356,569) (315,245)
Loan recoveries 91,509 110,426 116,463
Balance at end of year $1,282,504 $1,044,521 $1,028,128
1Amount removed from the allowance for loan losses related to the Company’s election to record $4.1 billion of residential mortgages at fair value.
96