SunTrust 2007 Annual Report Download - page 113
Download and view the complete annual report
Please find page 113 of the 2007 SunTrust annual report below. You can navigate through the pages in the report by either clicking on the pages listed below, or by using the keyword search tool below to find specific information within the annual report.-
 1
1 -
2
-
3
-
4
-
5
-
6
-
7
-
8
-
9
-
10
-
11
-
12
-
13
-
14
-
15
-
16
-
17
-
18
-
19
-
20
-
21
-
22
-
23
-
24
-
25
-
26
-
27
-
28
-
29
-
30
-
31
-
32
-
33
-
34
-
35
-
36
-
37
-
38
-
39
-
40
-
41
-
42
-
43
-
44
-
45
-
46
-
47
-
48
-
49
-
50
-
51
-
52
-
53
-
54
-
55
-
56
-
57
-
58
-
59
-
60
-
61
-
62
-
63
-
64
-
65
-
66
-
67
-
68
-
69
-
70
-
71
-
72
-
73
-
74
-
75
-
76
-
77
-
78
-
79
-
80
-
81
-
82
-
83
-
84
-
85
-
86
-
87
-
88
-
89
-
90
-
91
-
92
-
93
-
94
-
95
-
96
-
97
-
98
-
99
-
100
-
101
-
102
-
 103
103 -
 104
104 -
 105
105 -
 106
106 -
 107
107 -
 108
108 -
 109
109 -
 110
110 -
 111
111 -
 112
112 -
 113
113 -
 114
114 -
 115
115 -
 116
116 -
 117
117 -
 118
118 -
 119
119 -
 120
120 -
 121
121 -
 122
122 -
 123
123 -
124
-
125
-
126
-
127
-
128
-
129
-
130
-
131
-
132
-
133
-
134
-
135
-
136
-
137
-
138
-
139
-
140
-
141
-
142
-
143
-
144
-
145
-
146
-
147
-
148
-
149
-
150
-
151
-
152
-
153
-
154
-
155
-
156
-
157
-
158
-
159
-
160
-
161
-
162
-
163
-
164
-
165
-
166
-
167
-
168
 |
 |

SUNTRUST BANKS, INC.
Notes to Consolidated Financial Statements (Continued)
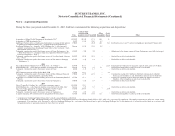
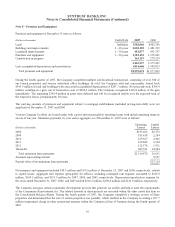
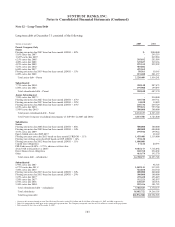
Other Securitizations
During 2007, the Company sold $2.3 billion of trust preferred securities and commercial loans and bonds into securitization
and structured asset transactions and recognized net gains related to these transactions of $8.0 million. Certain cash flows
from these securitizations are as follows for the twelve months ending December 31, 2007:
(Dollars in millions)
Commercial
Loans and
Bonds
Trust
Preferred
Securities
Proceeds from securitizations $2,186.4 $158.8
Collateral manager fees 9.3 -
Servicing fees received 1.1 -
Other cash flows received on retained interests 22.2 -
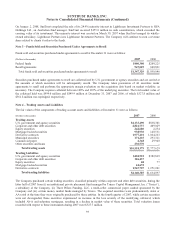
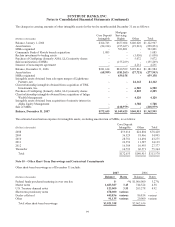
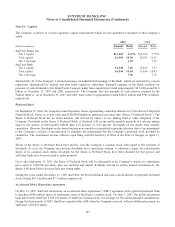
As of December 31, 2007, the Company had interests that continued to be held of $449.8 million classified as trading assets,
$358.8 million of which are investment grade securities. As of December 31, 2006, the Company had interests that continued
to be held of $9.6 million classified as securities available for sale and $47.0 million classified as trading assets. For residual
interests for which there is no quoted market price, management reviews the historical performance of each retained interest
and the assumptions used to project future cash flows on a quarterly basis. If past performance and future expectations
dictate, assumptions are revised and the present value of future cash flows is recalculated.
The key economic assumptions used to value residual interests retained at December 31, 2007 and sensitivity of the fair
values to immediate adverse changes in those assumptions are as follows:
(Dollars in millions)
Fair
Value
Weighted
Average Life
(in years)
Prepayment
Rate
Expected
Credit Losses
Annual Discount
Rate
Commercial and Other Loans
Residual $90.9 4.37 7% - 20% 0.35% - 2% 13% - 22%
As of December 31, 2007
Decline in fair value from 10%
adverse change $1.0 $1.0 $3.2
Decline in fair value from 20%
adverse change 1.8 1.7 6.2
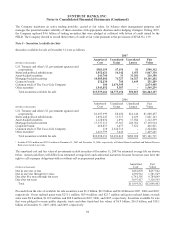
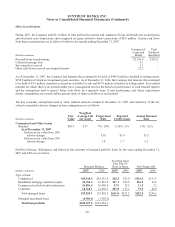
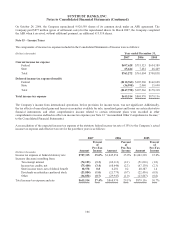
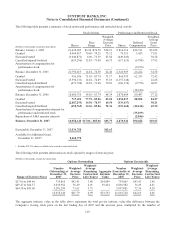
Portfolio balances, delinquency and historical loss amounts of managed portfolio loans for the years ending December 31,
2007 and 2006 are as follows:
Principal Balance
Accruing loans
Past Due 90
Days or More Net Charge-offs
(Dollars in millions) 2007 2006 2007 2006 2007 2006
Type of loan:
Commercial $40,346.0 $36,512.8 $26.2 $13.0 $116.6 $153.5
Residential mortgage and home equity 49,760.4 47,932.8 347.1 192.9 216.0 43.6
Commercial real estate and construction 26,806.6 26,460.8 33.9 32.5 11.2 2.2
Consumer 12,312.1 12,096.1 203.8 113.1 79.0 46.8
Total managed loans 129,225.1 123,002.5 $611.0 $351.5 $422.8 $246.1
Managed securitized loans (6,906.1) (1,548.2)
Total loan portfolio $122,319.0 $121,454.3
101