SunTrust 2007 Annual Report Download - page 126
Download and view the complete annual report
Please find page 126 of the 2007 SunTrust annual report below. You can navigate through the pages in the report by either clicking on the pages listed below, or by using the keyword search tool below to find specific information within the annual report.-
 1
1 -
2
-
3
-
4
-
5
-
6
-
7
-
8
-
9
-
10
-
11
-
12
-
13
-
14
-
15
-
16
-
17
-
18
-
19
-
20
-
21
-
22
-
23
-
24
-
25
-
26
-
27
-
28
-
29
-
30
-
31
-
32
-
33
-
34
-
35
-
36
-
37
-
38
-
39
-
40
-
41
-
42
-
43
-
44
-
45
-
46
-
47
-
48
-
49
-
50
-
51
-
52
-
53
-
54
-
55
-
56
-
57
-
58
-
59
-
60
-
61
-
62
-
63
-
64
-
65
-
66
-
67
-
68
-
69
-
70
-
71
-
72
-
73
-
74
-
75
-
76
-
77
-
78
-
79
-
80
-
81
-
82
-
83
-
84
-
85
-
86
-
87
-
88
-
89
-
90
-
91
-
92
-
93
-
94
-
95
-
96
-
97
-
98
-
99
-
100
-
101
-
102
-
103
-
104
-
105
-
106
-
107
-
108
-
109
-
110
-
111
-
112
-
113
-
114
-
115
-
 116
116 -
 117
117 -
 118
118 -
 119
119 -
 120
120 -
 121
121 -
 122
122 -
 123
123 -
 124
124 -
 125
125 -
 126
126 -
 127
127 -
 128
128 -
 129
129 -
 130
130 -
 131
131 -
 132
132 -
 133
133 -
 134
134 -
 135
135 -
 136
136 -
137
-
138
-
139
-
140
-
141
-
142
-
143
-
144
-
145
-
146
-
147
-
148
-
149
-
150
-
151
-
152
-
153
-
154
-
155
-
156
-
157
-
158
-
159
-
160
-
161
-
162
-
163
-
164
-
165
-
166
-
167
-
168
 |
 |

SUNTRUST BANKS, INC.
Notes to Consolidated Financial Statements (Continued)
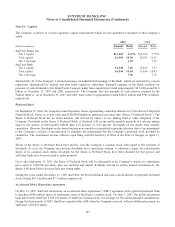
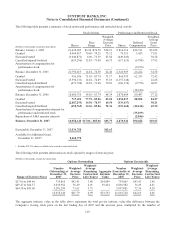
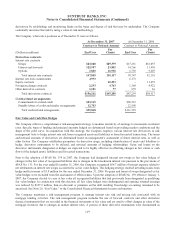
The change in plan assets for the years ended December 31 was as follows:
Retirement Benefits
Other Postretirement
Benefits
(Dollars in thousands) 2007 2006 2007 2006
Fair value of plan assets, beginning of year $2,216,179 $1,870,310 $162,973 $161,310
Actual return on plan assets 180,467 252,734 10,873 9,729
Employer contributions -182,000 580 7,628
Plan participants’ contributions --20,487 18,913
Benefits paid (109,324) (88,865) (32,032) (34,607)
Fair value of plan assets, end of year $2,287,322 $2,216,179 $162,881 $162,973
Employer contributions and benefits paid in the above table include only those amounts contributed to pay participants’ plan
benefits or added to plan assets in 2007 and 2006, respectively. Supplemental Retirement Plans are not funded through plan
assets.
The fair value of plan assets (in thousands) for the retirement plans is $2,287,322 and $2,216,179 at the end of 2007 and
2006, respectively. The expected long-term rate of return on these plan assets was 8.50% in 2007 and 2006. The expected
long-term rate of return is 8.25% for 2008, based on a ten-year capital market projection of the current target asset allocation.
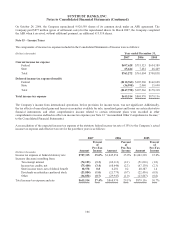
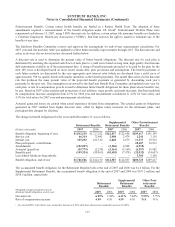
The asset allocation for the SunTrust and NCF Retirement Plans and the target allocation, by asset category, are as follows:
Target
Allocation1
Percentage of Plan Assets
at December 312
Asset Category 2008 2007 2006
Equity securities 70% 75% 79%
Debt securities 30 24 20
Cash equivalents - 11
Total 100% 100%
1SunTrust Retirement Plan only.
2SunTrust and NCF Retirement Plans.
At December 31, 2007 and 2006, there was no SunTrust common stock held in the SunTrust and NCF Retirement Plans.
The SunTrust Benefit Plan Committee, which includes several members of senior management, establishes investment
policies and strategies and formally monitors the performance of the funds on a quarterly basis. The Company’s investment
strategy with respect to pension assets is to invest the assets in accordance with the Employee Retirement Income Security
Act and fiduciary standards. The long-term primary objectives for the Retirement Plans are to provide for a reasonable
amount of long-term growth of capital (both principal and income), without undue exposure to risk and to enable the plans to
provide their specific benefits to participants thereof. Rebalancing occurs on a periodic basis to maintain the target allocation,
but normal market activity may result in deviations.
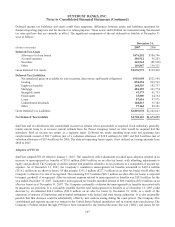
The investment strategy for the Other Postretirement Benefit Plans is maintained separately from the strategy for the
Retirement Plan. The Company’s investment strategy is to create a stream of investment return sufficient to provide for
current and future liabilities at a reasonable level of risk. The expected long-term rate of return on these plan assets was
7.50% in 2007 and in 2006. The 2008 expected long-term rate of return is also 7.50%
The asset allocation for Other Postretirement Benefit Plans and the target allocation, by asset category, are as follows:
Target
Allocation
Percentage of Plan Assets
at December 31
Asset Category 2008 2007 2006
Equity securities 35-50% 50% 49%
Debt securities 50-65 50 45
Other - -6
Total 100% 100%
114