SunTrust 2007 Annual Report Download - page 30
Download and view the complete annual report
Please find page 30 of the 2007 SunTrust annual report below. You can navigate through the pages in the report by either clicking on the pages listed below, or by using the keyword search tool below to find specific information within the annual report.-
 1
1 -
2
-
3
-
4
-
5
-
6
-
7
-
8
-
9
-
10
-
11
-
12
-
13
-
14
-
15
-
16
-
17
-
18
-
19
-
 20
20 -
 21
21 -
 22
22 -
 23
23 -
 24
24 -
 25
25 -
 26
26 -
 27
27 -
 28
28 -
 29
29 -
 30
30 -
 31
31 -
 32
32 -
 33
33 -
 34
34 -
 35
35 -
 36
36 -
 37
37 -
 38
38 -
 39
39 -
 40
40 -
41
-
42
-
43
-
44
-
45
-
46
-
47
-
48
-
49
-
50
-
51
-
52
-
53
-
54
-
55
-
56
-
57
-
58
-
59
-
60
-
61
-
62
-
63
-
64
-
65
-
66
-
67
-
68
-
69
-
70
-
71
-
72
-
73
-
74
-
75
-
76
-
77
-
78
-
79
-
80
-
81
-
82
-
83
-
84
-
85
-
86
-
87
-
88
-
89
-
90
-
91
-
92
-
93
-
94
-
95
-
96
-
97
-
98
-
99
-
100
-
101
-
102
-
103
-
104
-
105
-
106
-
107
-
108
-
109
-
110
-
111
-
112
-
113
-
114
-
115
-
116
-
117
-
118
-
119
-
120
-
121
-
122
-
123
-
124
-
125
-
126
-
127
-
128
-
129
-
130
-
131
-
132
-
133
-
134
-
135
-
136
-
137
-
138
-
139
-
140
-
141
-
142
-
143
-
144
-
145
-
146
-
147
-
148
-
149
-
150
-
151
-
152
-
153
-
154
-
155
-
156
-
157
-
158
-
159
-
160
-
161
-
162
-
163
-
164
-
165
-
166
-
167
-
168
 |
 |
• Upon electing to record certain financial assets and financial liabilities at fair value and simultaneously hedging the
changes in fair value, we were able to mitigate a significant amount of potential earnings volatility from changes in
fair value.
• The financial assets or financial liabilities we elected to record at fair value were entire classes of similar assets or
liabilities that we decided to actively hedge and/or trade. We continue to evaluate new originations of eligible
financial instruments to determine if we should elect to record these financial assets or liabilities at fair value. We
expect to make further fair value elections in the future when such elections align with our balance sheet
management strategies.
• We chose to sell entire classes of assets transferred to fair value, as we determined that it was no longer desirable to
hold these assets on our balance sheet. In addition, we reduced wholesale funding (namely Fed funds and other
overnight borrowings) and acquired securities that were significantly different than the securities we sold, resulting
in a significantly different balance sheet composition that will improve our financial performance and reduce our
earnings volatility especially pertaining to net interest income.
• We evaluated the expanded use of fair value both at an entity-wide level, as well as at the asset class level. At
adoption, our election to record at fair value several classes of financial assets and financial liabilities demonstrated
the comprehensive nature of our balance sheet management strategies, and our intent to use fair value as a
measurement attribute on a go-forward basis. Furthermore, we expanded the use of fair value in each of these
classes of financial assets and financial liabilities by electing fair value for new purchases and/or issuances of
securities, loans, and debt during 2007.
The following discussion elaborates on our rationale for electing to record certain financial assets and financial liabilities at
fair value, as well as provides relevant balance sheet and earnings information for those assets and liabilities carried at fair
value. See Note 20, “Fair Value,” to the Consolidated Financial Statements for more information.
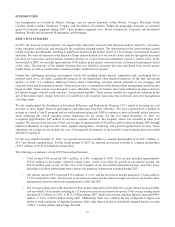
The economic environment since early 2006 has created financial challenges for financial institutions, specifically
constraining the ability to grow net interest income. The flat to inverted yield curve has persisted for an unprecedented length
of time compressing the interest spread on earning assets. In addition, the general market environment has constrained
customer deposit growth, as customers shifted deposits into alternative investments and/or higher rate deposit products,
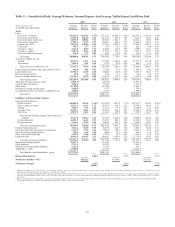
accentuating the pressure on net interest margin. Average earning assets increased 8.0% in 2006 compared to 2005 and the
average yield increased 92 basis points, while average customer deposits increased 4.1% in 2006 and the average rate on
interest bearing customer deposits increased 106 basis points. The increase in deposits was entirely in higher cost time
deposits, increasing 34.4%, while all other deposit products decreased 4.1%. Of particular note, average demand deposits
declined 4.1% compared to 2005. The incremental earning asset growth not supported by customer deposits resulted in a
55.4% increase in wholesale deposits, with an average rate in 2006 of approximately 5%, which was more than 150 basis
points higher than the average rate in 2005. All of the above dynamics resulted in a 17 basis point decline in our net interest
margin during 2006.
In order to respond to the reduction in net interest margin, we began employing specific asset/liability management strategies
beginning in the second quarter of 2006 that focused on moderating balance sheet growth. These strategies involved moderately
downsizing our loan and securities portfolios, focusing on lower yielding assets and reducing reliance on higher rate wholesale
deposits. We executed several specific transactions in 2006 that included the sale or securitization of $1.8 billion of residential
real estate loans and $2.1 billion of student loans. We elected to warehouse, and subsequently sell, residential real estate loans in
the secondary market that in the past had been placed in portfolio. Additionally, we sold $4.4 billion of shorter-term securities,
primarily mortgage-backed and agency securities, with a 3.6% average yield and reinvested approximately $2.4 billion in
longer-term securities with a 5.6% average yield. This combination of transactions caused a $2.0 billion reduction in the
securities portfolio in the third and fourth quarters of 2006. Finally, we executed $1.5 billion in notional amount of receive-fixed
interest rate swaps, which were designated as cash flow hedges under SFAS No. 133 on commercial loans, to extend the
duration of the balance sheet and improve the overall earning asset yield.
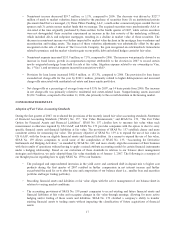
We also restructured aspects of our capital in the third and fourth quarters of 2006, reducing our cost of capital while
strengthening our Tier 1 capital position. These capital restructuring initiatives contributed to our “well capitalized” status, as
Tier 1 capital increased to 7.72%, as of December 31, 2006, up 71 basis points from the prior year end.
18