SunTrust 2007 Annual Report Download - page 39
Download and view the complete annual report
Please find page 39 of the 2007 SunTrust annual report below. You can navigate through the pages in the report by either clicking on the pages listed below, or by using the keyword search tool below to find specific information within the annual report.-
 1
1 -
2
-
3
-
4
-
5
-
6
-
7
-
8
-
9
-
10
-
11
-
12
-
13
-
14
-
15
-
16
-
17
-
18
-
19
-
20
-
21
-
22
-
23
-
24
-
25
-
26
-
27
-
28
-
 29
29 -
 30
30 -
 31
31 -
 32
32 -
 33
33 -
 34
34 -
 35
35 -
 36
36 -
 37
37 -
 38
38 -
 39
39 -
 40
40 -
 41
41 -
 42
42 -
 43
43 -
 44
44 -
 45
45 -
 46
46 -
 47
47 -
 48
48 -
 49
49 -
50
-
51
-
52
-
53
-
54
-
55
-
56
-
57
-
58
-
59
-
60
-
61
-
62
-
63
-
64
-
65
-
66
-
67
-
68
-
69
-
70
-
71
-
72
-
73
-
74
-
75
-
76
-
77
-
78
-
79
-
80
-
81
-
82
-
83
-
84
-
85
-
86
-
87
-
88
-
89
-
90
-
91
-
92
-
93
-
94
-
95
-
96
-
97
-
98
-
99
-
100
-
101
-
102
-
103
-
104
-
105
-
106
-
107
-
108
-
109
-
110
-
111
-
112
-
113
-
114
-
115
-
116
-
117
-
118
-
119
-
120
-
121
-
122
-
123
-
124
-
125
-
126
-
127
-
128
-
129
-
130
-
131
-
132
-
133
-
134
-
135
-
136
-
137
-
138
-
139
-
140
-
141
-
142
-
143
-
144
-
145
-
146
-
147
-
148
-
149
-
150
-
151
-
152
-
153
-
154
-
155
-
156
-
157
-
158
-
159
-
160
-
161
-
162
-
163
-
164
-
165
-
166
-
167
-
168
 |
 |

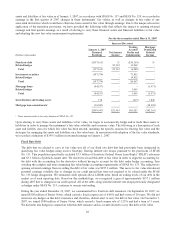
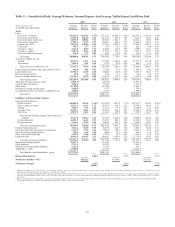
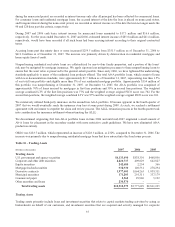
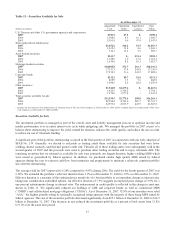
Table 3 – Noninterest Income
Year Ended December 31
(Dollars in millions) 2007 2006 2005 2004 2003 2002
Service charges on deposit accounts $822.0 $763.7 $772.5 $700.0 $643.1 $612.9
Trust and investment management income 685.0 686.9 673.7 586.8 502.4 504.5
Retail investment services 278.0 234.0 213.3 192.8 161.8 136.7
Other charges and fees 479.1 462.1 456.5 390.5 326.3 296.9
Card fees 280.7 247.6 210.8 153.4 119.6 120.0
Investment banking income 214.9 230.6 216.5 206.7 192.5 177.0
Trading account profits/(losses) and commissions (361.7) 113.0 145.1 127.8 109.9 103.2
Mortgage servicing related income (expense) 195.4 121.7 41.9 11.1 (177.5) (110.1)
Net gain on sale/leaseback of premises 118.8 -----
Mortgage production related income 91.0 217.4 144.9 57.8 150.1 92.3
Gain on sale upon merger of Lighthouse Partners 32.3 -----
Net gain on sale of Bond Trustee business -112.8 - - - -
Net gain on sale of RCM assets -- 23.4 - - -
Other noninterest income 350.1 329.1 263.6 219.2 150.9 130.9
Total noninterest income before net securities
gains/(losses) 3,185.6 3,518.9 3,162.2 2,646.1 2,179.1 2,064.3
Net securities gains/(losses) 243.1 (50.5) (7.2) (41.7) 123.9 204.5
Total noninterest income $3,428.7 $3,468.4 $3,155.0 $2,604.4 $2,303.0 $2,268.8
Noninterest Income
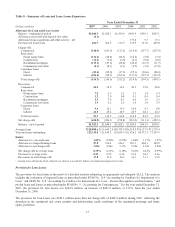
Noninterest income decreased by $39.7 million, or 1.1%, in 2007, compared to 2006. This decrease was driven by the
negative impact of the turmoil in the capital markets that caused net mark to market valuation losses related to the purchase
of certain securities and market value declines in the mortgage loan warehouse and securitization and trading assets.
Positively impacting noninterest income in 2007 were increases in service charges on deposits, mortgage servicing related
income, retail investment services, card fees, and other charges and fees. In addition, results for 2007 were impacted by the
$234.8 million gain recognized on the sale of shares of The Coca-Cola Company, the $32.3 million gain recognized upon the
merger of Lighthouse Partners, the $118.8 million gain on sale/leaseback of premises, and a $21.0 million increase in other
income, primarily related to gains from the sale of private equity investments. In 2006 there was a $112.8 million gain, net of
related expenses, on the sale of the Bond Trustee business, which positively impacted total noninterest income in 2006.
Trading account profits/(losses) and commissions declined $474.7 million due primarily to $527.7 million in negative mark
to market valuations on collateralized debt obligations, MBS, SIV securities, and collateralized loan obligations, that
occurred during the latter half of 2007. Contributing to these losses were negative mark to market valuation losses on
securitization warehouses and trading activities. These losses were partially offset by market valuation gains of $164.4
million on changes in fair value of our public debt, including related hedges, higher profits from customer transactions in
derivatives, structured leasing, merchant banking and equipment lease financing. See “Trading Assets” section in MD&A for
further discussion. During 2006, trading related losses were primarily due to negative interest rate related marks on
securitization residuals and economic hedges. Investment Banking income declined $15.7 million, or 6.8%, compared to
2006 due to lower securitization and syndicated finance activities.
Combined mortgage related income decreased $52.7 million, or 15.5%, compared to 2006. Mortgage production related
income for 2007 was down $126.4 million, or 58.1%, compared to 2006. This decrease was primarily due to $165.4 million
of net valuation losses in the second half of 2007 caused by spread widening related to mortgage loans held for sale, partially
offset by the recognition of approximately $79 million of loan origination fees resulting from our election to record certain
mortgage loans at fair value beginning in May 2007. Mortgage servicing related income increased $73.7 million, or 60.5%,
compared to 2006. Mortgage servicing included gains on the sale of MSRs of $51.2 million during 2007 compared to $66.3
million in 2006 related to $219.0 million and $155.3 million of MSRs sold, respectively. This decrease mitigated the overall
increase in mortgage servicing related income, which was principally due to higher fee income derived from a growing
servicing portfolio. At December 31, 2007, total loans serviced for others was $114.6 billion compared with $91.5 billion at
27