SunTrust 2007 Annual Report Download - page 38
Download and view the complete annual report
Please find page 38 of the 2007 SunTrust annual report below. You can navigate through the pages in the report by either clicking on the pages listed below, or by using the keyword search tool below to find specific information within the annual report.-
 1
1 -
2
-
3
-
4
-
5
-
6
-
7
-
8
-
9
-
10
-
11
-
12
-
13
-
14
-
15
-
16
-
17
-
18
-
19
-
20
-
21
-
22
-
23
-
24
-
25
-
26
-
27
-
 28
28 -
 29
29 -
 30
30 -
 31
31 -
 32
32 -
 33
33 -
 34
34 -
 35
35 -
 36
36 -
 37
37 -
 38
38 -
 39
39 -
 40
40 -
 41
41 -
 42
42 -
 43
43 -
 44
44 -
 45
45 -
 46
46 -
 47
47 -
 48
48 -
49
-
50
-
51
-
52
-
53
-
54
-
55
-
56
-
57
-
58
-
59
-
60
-
61
-
62
-
63
-
64
-
65
-
66
-
67
-
68
-
69
-
70
-
71
-
72
-
73
-
74
-
75
-
76
-
77
-
78
-
79
-
80
-
81
-
82
-
83
-
84
-
85
-
86
-
87
-
88
-
89
-
90
-
91
-
92
-
93
-
94
-
95
-
96
-
97
-
98
-
99
-
100
-
101
-
102
-
103
-
104
-
105
-
106
-
107
-
108
-
109
-
110
-
111
-
112
-
113
-
114
-
115
-
116
-
117
-
118
-
119
-
120
-
121
-
122
-
123
-
124
-
125
-
126
-
127
-
128
-
129
-
130
-
131
-
132
-
133
-
134
-
135
-
136
-
137
-
138
-
139
-
140
-
141
-
142
-
143
-
144
-
145
-
146
-
147
-
148
-
149
-
150
-
151
-
152
-
153
-
154
-
155
-
156
-
157
-
158
-
159
-
160
-
161
-
162
-
163
-
164
-
165
-
166
-
167
-
168
 |
 |
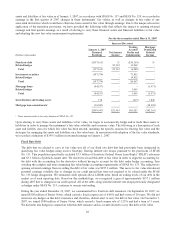
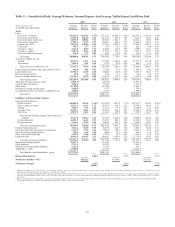
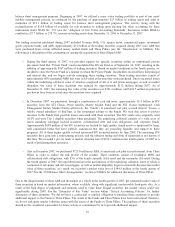
Net Interest Income/Margin
Fully-taxable equivalent net interest income for 2007 was $4,822.2 million, an increase of $73.8 million, or 1.6%, from 2006.
The increase in net interest income was primarily the result of balance sheet management strategies implemented throughout
2007 and 2006. Lower yielding loans and investment securities were reclassified to loans held for sale and trading assets,
respectively, and a portion of these assets was subsequently sold enabling a reduction in higher cost liabilities.
For 2007, average earning assets decreased $3.2 billion, or 2.0%, while average interest-bearing liabilities decreased $1.2
billion, or 0.9%, compared to 2006. This decline was a result of balance sheet management strategies, which resulted in the
sale of nearly $10 billion in loans during 2007, primarily comprised of mortgage loans, student loans, and corporate loans.
Average securities available for sale were $11.3 billion during 2007, a decrease of $13.1 billion, or 53.6%, compared to
2006. In the first quarter of 2007, approximately $16.0 billion of securities were reclassified into trading assets to enable
more active trading of a significant portion of this portfolio and reduce the overall size of securities available for sale. The
decrease in average securities available for sale more than offset the growth of $9.9 billion in interest earning trading assets
and the $0.4 billion growth in loans, net of the aforementioned sales of loans.
Average consumer and commercial deposits increased $0.8 billion, or 0.9%, in 2007 compared to 2006. This included
increases of $2.2 billion in higher cost certificates of deposit and $2.8 billion in NOW account balances. These were partially
offset by decreases of $0.8 billion in savings, $1.8 billion in money market, and $1.6 billion in demand deposits. We
continue to pursue deposit growth initiatives utilizing product promotions along with efforts to increase our presence in
specific markets within our footprint.
The net interest margin increased 11 basis points from 3.00% in 2006 to 3.11% in 2007. The sale of lower yielding assets
enabled a reduction in higher cost funding, thus improving the margin. The earning asset yield improved 29 basis points from
6.24% to 6.53% for 2007, while the cost of interest-bearing liabilities over the same period increased 17 basis points from
3.88% to 4.05%.
After exhibiting an upward trend during the first three quarters of 2007, the net interest margin declined from 3.18% during
the third quarter of 2007 to 3.13% during the fourth quarter of 2007. Deposit pricing pressures along with declines in earning
asset yields drove the decline, offset somewhat by the benefit of lower wholesale funding costs. We expect to continue to
experience slight compression in the first quarter of 2008 as a result of the impact of the trading securities purchased during
the fourth quarter of 2007 and then expect net interest margin to stabilize and possibly even expand during the remainder of
2008. Stabilizing or expanding margin will require some of the following to occur:
• the pressure upon deposit pricing subsides,
• we achieve continued success in growing our deposit base,
• the yield curve steepens,
• the market demonstrates a normalized LIBOR/prime relationship, and
• the level of nonperforming assets stabilizes or declines.
The net interest margin trends occurred in a market environment characterized by a continued flat to inverted yield curve.
The Fed Funds target rate averaged 5.05% for 2007, an increase of 9 basis points compared to 2006. The Prime rate averaged
8.05% for 2007, an increase of 9 basis points compared to 2006. One-month LIBOR increased 12 basis points to 5.25%,
three-month LIBOR increased 10 basis points to 5.30%, five-year swaps decreased 22 basis points to 5.01% and ten-year
swaps decreased 9 basis points to 5.24% compared to prior year. This yield curve inversion negatively impacts us because
rates on deposits, our most significant funding source, tend to track movements in three-month LIBOR while our loan yields
tend to track movements in the five-year swap rate. Certain floating rate loans, floating rate liabilities, and derivative
contracts contractually reset to the Prime rate as well as LIBOR. To the extent that these rates reset on a different frequency
or a different rate relative to each other net interest income is affected. During the third and fourth quarter of 2007, one
month LIBOR, three month LIBOR, and the Prime rate varied significantly versus each other.
Interest income that we were unable to recognize on nonperforming loans had a negative impact of four basis points on net
interest margin in 2007 compared to one basis point of negative impact in 2006, as average nonaccrual loans increased
$416.9 million, or 97.0% over 2006. Table 2 contains more detailed information concerning average loans, yields and rates
paid.
26