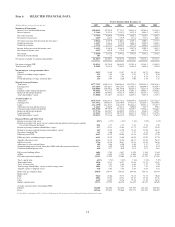
SunTrust 2007 Annual Report Download - page 36
Download and view the complete annual report
Please find page 36 of the 2007 SunTrust annual report below. You can navigate through the pages in the report by either clicking on the pages listed below, or by using the keyword search tool below to find specific information within the annual report.-
 1
1 -
2
-
3
-
4
-
5
-
6
-
7
-
8
-
9
-
10
-
11
-
12
-
13
-
14
-
15
-
16
-
17
-
18
-
19
-
20
-
21
-
22
-
23
-
24
-
25
-
 26
26 -
 27
27 -
 28
28 -
 29
29 -
 30
30 -
 31
31 -
 32
32 -
 33
33 -
 34
34 -
 35
35 -
 36
36 -
 37
37 -
 38
38 -
 39
39 -
 40
40 -
 41
41 -
 42
42 -
 43
43 -
 44
44 -
 45
45 -
 46
46 -
47
-
48
-
49
-
50
-
51
-
52
-
53
-
54
-
55
-
56
-
57
-
58
-
59
-
60
-
61
-
62
-
63
-
64
-
65
-
66
-
67
-
68
-
69
-
70
-
71
-
72
-
73
-
74
-
75
-
76
-
77
-
78
-
79
-
80
-
81
-
82
-
83
-
84
-
85
-
86
-
87
-
88
-
89
-
90
-
91
-
92
-
93
-
94
-
95
-
96
-
97
-
98
-
99
-
100
-
101
-
102
-
103
-
104
-
105
-
106
-
107
-
108
-
109
-
110
-
111
-
112
-
113
-
114
-
115
-
116
-
117
-
118
-
119
-
120
-
121
-
122
-
123
-
124
-
125
-
126
-
127
-
128
-
129
-
130
-
131
-
132
-
133
-
134
-
135
-
136
-
137
-
138
-
139
-
140
-
141
-
142
-
143
-
144
-
145
-
146
-
147
-
148
-
149
-
150
-
151
-
152
-
153
-
154
-
155
-
156
-
157
-
158
-
159
-
160
-
161
-
162
-
163
-
164
-
165
-
166
-
167
-
168
 |
 |

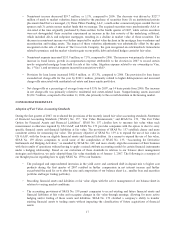
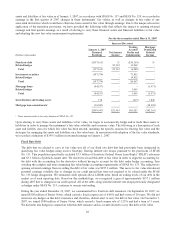
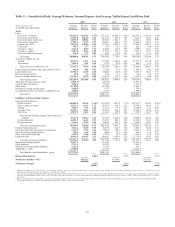
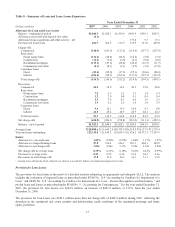
Table 1 – Analysis of Changes in Net Interest Income1
2007 Compared to 2006
Increase (Decrease) Due to
2006 Compared to 2005
Increase (Decrease) Due to
(Dollars in millions on a taxable-equivalent basis) Volume Rate Net Volume Rate Net
Interest Income
Loans:
Real estate 1-4 family ($97.2) $111.1 $13.9 $382.6 $180.5 $563.1
Real estate construction 88.4 (1.2) 87.2 188.4 136.5 324.9
Real estate home equity lines 35.5 20.4 55.9 77.3 214.6 291.9
Real estate commercial - 20.9 20.9 57.6 117.5 175.1
Commercial - FTE222.4 92.8 115.2 51.8 346.8 398.6
Credit card 8.4 (9.8) (1.4) 5.5 (1.2) 4.3
Consumer – direct (17.1) 8.4 (8.7) (80.0) 57.3 (22.7)
Consumer – indirect (21.1) 38.9 17.8 (25.1) 26.1 1.0
Nonaccrual and restructured 10.9 (10.2) 0.7 4.4 (1.0) 3.4
Securities available for sale:
Taxable (761.9) 254.2 (507.7) (98.3) 108.1 9.8
Tax-exempt25.3 1.1 6.4 5.0 (0.9) 4.1
Funds sold and securities purchased under agreements to
resell (8.1) (0.1) (8.2) (8.6) 22.4 13.8
Loans held for sale (19.0) (40.1) (59.1) 166.3 76.0 242.3
Interest-bearing deposits (3.2) 1.2 (2.0) 2.5 - 2.5
Interest earning trading assets 546.3 (18.6) 527.7 23.7 37.4 61.1
Total interest income (210.4) 469.0 258.6 753.1 1,320.1 2,073.2
Interest Expense
NOW accounts 56.6 109.5 166.1 - 139.0 139.0
Money market accounts (49.5) 37.5 (12.0) (19.2) 214.8 195.6
Savings (10.3) (13.3) (23.6) (9.6) 31.6 22.0
Consumer time 54.4 95.2 149.6 101.0 158.8 259.8
Other time 42.4 51.0 93.4 147.3 106.8 254.1
Brokered deposits (69.7) 50.4 (19.3) 321.9 204.2 526.1
Foreign deposits (170.4) 12.3 (158.1) 84.6 150.6 235.2
Funds purchased (60.0) 3.6 (56.4) 20.3 74.1 94.4
Securities sold under agreements to repurchase (42.2) (4.1) (46.3) 19.9 116.6 136.5
Interest-bearing trading liabilities 1.0 (0.9) 0.1 (0.8) 4.4 3.6
Other short-term borrowings 47.9 (1.4) 46.5 (43.0) 34.3 (8.7)
Long-term debt 112.2 (67.4) 44.8 (143.9) 265.6 121.7
Total interest expense (87.6) 272.4 184.8 478.5 1,500.8 1,979.3
Net change in net interest income ($122.8) $196.6 $73.8 $274.6 ($180.7) $93.9
1Changes in net interest income are attributed to either changes in average balances (volume change) or changes in average rates (rate change) for earning
assets and sources of funds on which interest is received or paid. Volume change is calculated as change in volume times the previous rate, while rate
change is change in rate times the previous volume. The rate/volume change, change in rate times change in volume, is allocated between volume change
and rate change at the ratio each component bears to the absolute value of their total.
2Interest income includes the effects of taxable-equivalent adjustments (reduced by the nondeductible portion of interest expense) using a federal income
tax rate of 35% and, where applicable, state income taxes to increase tax-exempt interest income to a taxable-equivalent basis.
24