SunTrust 2007 Annual Report Download - page 145
Download and view the complete annual report
Please find page 145 of the 2007 SunTrust annual report below. You can navigate through the pages in the report by either clicking on the pages listed below, or by using the keyword search tool below to find specific information within the annual report.-
 1
1 -
2
-
3
-
4
-
5
-
6
-
7
-
8
-
9
-
10
-
11
-
12
-
13
-
14
-
15
-
16
-
17
-
18
-
19
-
20
-
21
-
22
-
23
-
24
-
25
-
26
-
27
-
28
-
29
-
30
-
31
-
32
-
33
-
34
-
35
-
36
-
37
-
38
-
39
-
40
-
41
-
42
-
43
-
44
-
45
-
46
-
47
-
48
-
49
-
50
-
51
-
52
-
53
-
54
-
55
-
56
-
57
-
58
-
59
-
60
-
61
-
62
-
63
-
64
-
65
-
66
-
67
-
68
-
69
-
70
-
71
-
72
-
73
-
74
-
75
-
76
-
77
-
78
-
79
-
80
-
81
-
82
-
83
-
84
-
85
-
86
-
87
-
88
-
89
-
90
-
91
-
92
-
93
-
94
-
95
-
96
-
97
-
98
-
99
-
100
-
101
-
102
-
103
-
104
-
105
-
106
-
107
-
108
-
109
-
110
-
111
-
112
-
113
-
114
-
115
-
116
-
117
-
118
-
119
-
120
-
121
-
122
-
123
-
124
-
125
-
126
-
127
-
128
-
129
-
130
-
131
-
132
-
133
-
134
-
 135
135 -
 136
136 -
 137
137 -
 138
138 -
 139
139 -
 140
140 -
 141
141 -
 142
142 -
 143
143 -
 144
144 -
 145
145 -
 146
146 -
 147
147 -
 148
148 -
 149
149 -
 150
150 -
 151
151 -
 152
152 -
 153
153 -
 154
154 -
 155
155 -
156
-
157
-
158
-
159
-
160
-
161
-
162
-
163
-
164
-
165
-
166
-
167
-
168
 |
 |

SUNTRUST BANKS, INC.
Notes to Consolidated Financial Statements (Continued)
rates observable in the market, is highly dependent on the ultimate closing of the loans. These “pull-through” rates are based
on the Company’s historical data and reflect an estimate of the likelihood of a commitment that will ultimately result in a
closed loan.
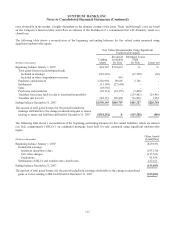
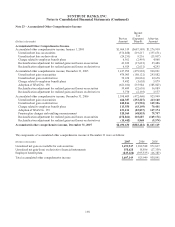
The following table shows a reconciliation of the beginning and ending balances for fair valued assets measured using
significant unobservable inputs:
Fair Value Measurements Using Significant
Unobservable Inputs
(Dollars in thousands)
Trading
Assets
Securities
Available
for Sale
Mortgage Loans
Held
for Sale Loans, net
Beginning balance January 1, 2007 $24,393 $734,633 $- $-
Total gains/(losses) (realized/unrealized):
Included in earnings (518,242) - (15,528) (60)
Included in other comprehensive income - 416 - -
Purchases and issuances 2,586,901 90,605 2,786 -
Settlements (11,149) (27,604) - -
Sales (49,550) - - -
Paydowns and maturities (66,361) (34,152) (2,498) -
Transfers from loans held for sale to loans held in portfolio - - (219,461) 219,461
Transfers into Level 3 984,153 105,809 716,028 1,383
Ending balance December 31, 2007 $2,950,145 $869,707 $481,327 $220,784
The amount of total gains/(losses) for the period included in
earnings attributable to the change in unrealized gains or losses
relating to assets and liabilities still held at December 31, 2007 ($518,242) $- ($15,528) ($60)
The following table shows a reconciliation of the beginning and ending balances for fair valued liabilities, which are interest
rate lock commitments (“IRLCs”) on residential mortgage loans held for sale, measured using significant unobservable
inputs:
(Dollars in thousands)
Other Assets/
(Liabilities)
Beginning balance January 1, 2007 ($29,633)
Included in earnings:
Issuances (inception value) (183,336)
Fair value changes (115,563)
Expirations 91,458
Settlements of IRLCs and transfers into closed loans 217,471
Ending balance December 31, 2007 ($19,603)
The amount of total gains/(losses) for the period included in earnings attributable to the change in unrealized
gains or losses relating to IRLCs still held at December 31, 2007 ($19,603)
133