SunTrust 2007 Annual Report Download - page 109
Download and view the complete annual report
Please find page 109 of the 2007 SunTrust annual report below. You can navigate through the pages in the report by either clicking on the pages listed below, or by using the keyword search tool below to find specific information within the annual report.-
 1
1 -
2
-
3
-
4
-
5
-
6
-
7
-
8
-
9
-
10
-
11
-
12
-
13
-
14
-
15
-
16
-
17
-
18
-
19
-
20
-
21
-
22
-
23
-
24
-
25
-
26
-
27
-
28
-
29
-
30
-
31
-
32
-
33
-
34
-
35
-
36
-
37
-
38
-
39
-
40
-
41
-
42
-
43
-
44
-
45
-
46
-
47
-
48
-
49
-
50
-
51
-
52
-
53
-
54
-
55
-
56
-
57
-
58
-
59
-
60
-
61
-
62
-
63
-
64
-
65
-
66
-
67
-
68
-
69
-
70
-
71
-
72
-
73
-
74
-
75
-
76
-
77
-
78
-
79
-
80
-
81
-
82
-
83
-
84
-
85
-
86
-
87
-
88
-
89
-
90
-
91
-
92
-
93
-
94
-
95
-
96
-
97
-
98
-
 99
99 -
 100
100 -
 101
101 -
 102
102 -
 103
103 -
 104
104 -
 105
105 -
 106
106 -
 107
107 -
 108
108 -
 109
109 -
 110
110 -
 111
111 -
 112
112 -
 113
113 -
 114
114 -
 115
115 -
 116
116 -
 117
117 -
 118
118 -
 119
119 -
120
-
121
-
122
-
123
-
124
-
125
-
126
-
127
-
128
-
129
-
130
-
131
-
132
-
133
-
134
-
135
-
136
-
137
-
138
-
139
-
140
-
141
-
142
-
143
-
144
-
145
-
146
-
147
-
148
-
149
-
150
-
151
-
152
-
153
-
154
-
155
-
156
-
157
-
158
-
159
-
160
-
161
-
162
-
163
-
164
-
165
-
166
-
167
-
168
 |
 |

SUNTRUST BANKS, INC.
Notes to Consolidated Financial Statements (Continued)
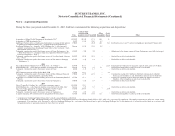
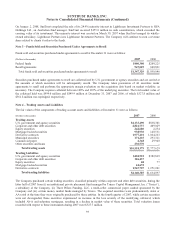
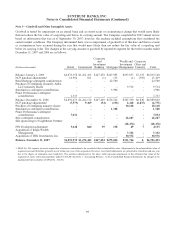
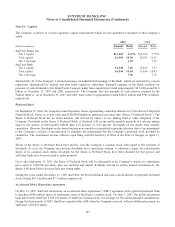
Note 8 – Premises and Equipment
Premises and equipment at December 31 were as follows:
(Dollars in thousands) Useful Life 2007 2006
Land Indefinite $382,066 $482,386
Buildings and improvements 2 - 40 years 1,002,105 1,481,222
Leasehold improvements 1 - 30 years 481,877 453,797
Furniture and equipment 1 - 20 years 1,381,130 1,278,801
Construction in progress 163,119 279,259
3,410,297 3,975,465
Less accumulated depreciation and amortization 1,814,606 1,998,053
Total premises and equipment $1,595,691 $1,977,412
During the fourth quarter of 2007, the Company completed multiple sale/leaseback transactions, consisting of over 300 of
our branch properties and various individual office buildings. In total, the Company sold and concurrently leased back
$545.9 million in land and buildings with associated accumulated depreciation of $285.7 million. Net proceeds were $764.4
million, resulting in a gain, net of transaction costs of $504.2 million. The Company recognized $118.8 million of the gain
immediately. The remaining $385.4 million in gains were deferred and will be recognized ratably over the expected term of
the respective leases, predominantly 10 years.
The carrying amounts of premises and equipment subject to mortgage indebtedness (included in long-term debt) were not
significant at December 31, 2007 and 2006.
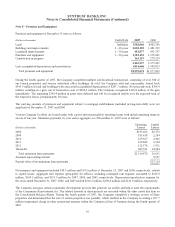
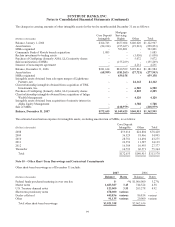
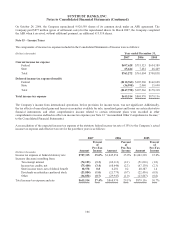
Various Company facilities are leased under both capital and noncancelable operating leases with initial remaining terms in
excess of one year. Minimum payments, by year and in aggregate, as of December 31, 2007 were as follows:
(Dollars in thousands)
Operating
Leases
Capital
Leases
2008 $193,666 $2,372
2009 181,458 2,384
2010 169,367 2,496
2011 149,888 2,544
2012 132,578 1,911
Thereafter 689,521 14,944
Total minimum lease payments $1,516,478 26,651
Amounts representing interest 9,527
Present value of net minimum lease payments $17,124
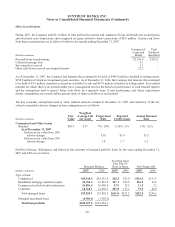
Net premises and equipment included $10.5 million and $14.3 million at December 31, 2007 and 2006, respectively, related
to capital leases. Aggregate rent expense (principally for offices), including contingent rent expense, amounted to $182.8
million, $169.5 million, and $153.5 million for 2007, 2006, and 2005, respectively. Depreciation/amortization expense for
the years ended December 31, 2007, 2006, and 2005 totaled $216.2 million, $209.4 million and $211.9 million, respectively.
The Company manages certain community development projects that generate tax credits and help it meet the requirements
of the Community Reinvestment Act. The related interests in these projects are recorded within the other assets line item on
the Consolidated Balance Sheets. During the fourth quarter of 2007, the Company completed a strategic review of these
properties and determined that the sale of certain properties was possible, which resulted in the Company recording a $57.7
million impairment charge in other noninterest expense within the Commercial line of business during the fourth quarter of
2007.
97