SunTrust 2007 Annual Report Download - page 40
Download and view the complete annual report
Please find page 40 of the 2007 SunTrust annual report below. You can navigate through the pages in the report by either clicking on the pages listed below, or by using the keyword search tool below to find specific information within the annual report.-
 1
1 -
2
-
3
-
4
-
5
-
6
-
7
-
8
-
9
-
10
-
11
-
12
-
13
-
14
-
15
-
16
-
17
-
18
-
19
-
20
-
21
-
22
-
23
-
24
-
25
-
26
-
27
-
28
-
29
-
 30
30 -
 31
31 -
 32
32 -
 33
33 -
 34
34 -
 35
35 -
 36
36 -
 37
37 -
 38
38 -
 39
39 -
 40
40 -
 41
41 -
 42
42 -
 43
43 -
 44
44 -
 45
45 -
 46
46 -
 47
47 -
 48
48 -
 49
49 -
 50
50 -
51
-
52
-
53
-
54
-
55
-
56
-
57
-
58
-
59
-
60
-
61
-
62
-
63
-
64
-
65
-
66
-
67
-
68
-
69
-
70
-
71
-
72
-
73
-
74
-
75
-
76
-
77
-
78
-
79
-
80
-
81
-
82
-
83
-
84
-
85
-
86
-
87
-
88
-
89
-
90
-
91
-
92
-
93
-
94
-
95
-
96
-
97
-
98
-
99
-
100
-
101
-
102
-
103
-
104
-
105
-
106
-
107
-
108
-
109
-
110
-
111
-
112
-
113
-
114
-
115
-
116
-
117
-
118
-
119
-
120
-
121
-
122
-
123
-
124
-
125
-
126
-
127
-
128
-
129
-
130
-
131
-
132
-
133
-
134
-
135
-
136
-
137
-
138
-
139
-
140
-
141
-
142
-
143
-
144
-
145
-
146
-
147
-
148
-
149
-
150
-
151
-
152
-
153
-
154
-
155
-
156
-
157
-
158
-
159
-
160
-
161
-
162
-
163
-
164
-
165
-
166
-
167
-
168
 |
 |

December 31, 2006. An analysis of the fair value of our MSRs under varying interest rate environments suggests that falling
mortgage interest rates coupled with increases in loan prepayments could cause impairment of this asset in the future.
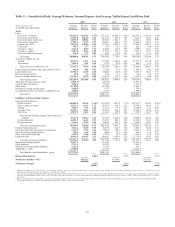
Retail investment services increased $44.0 million, or 18.8%, compared to 2006. The increase was driven by higher annuity
sales and higher recurring managed accounts fees. Service charges on deposit accounts increased $58.3 million, or 7.6%,
during 2007 compared to 2006, due primarily to higher non sufficient fund fees.
Trust and investment management income decreased $1.9 million, or 0.3%, compared to 2006. The slight decline was
primarily due to lost revenue from the Lighthouse Partners merger and sale of the Bond Trustee business, offset by growth in
core revenue.
Card fees, which include fees from business credit cards and debit cards from consumers and businesses, increased $33.1
million, or 13.4%, from 2006. This increase was primarily due to higher interchange fees driven by higher transaction
volumes.
Other charges and fees increased $17.0 million, or 3.7%, from 2006. The increase was due to higher operating lease income
and insurance income. These increases were partially offset by decreases in loan fees and letter of credit fees.
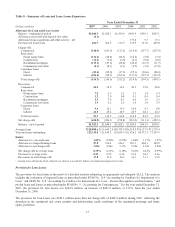
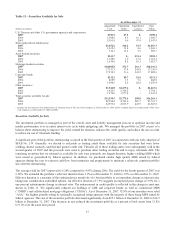
Table 4 – Noninterest Expense
Year Ended December 31
(Dollars in millions) 2007 2006 2005 2004 2003 2002
Employee compensation $2,329.0 $2,253.5 $2,117.2 $1,804.9 $1,585.9 $1,512.1
Employee benefits 441.2 471.9 417.1 363.4 358.6 306.4
Total personnel expense 2,770.2 2,725.4 2,534.3 2,168.3 1,944.5 1,818.5
Outside processing and software 410.9 393.6 357.4 286.3 246.7 225.2
Net occupancy expense 351.2 334.2 312.1 268.2 237.3 229.3
Equipment expense 206.5 197.0 204.0 184.9 178.4 174.8
Marketing and customer development 195.0 173.2 156.7 128.3 100.3 80.0
Operating losses over and short 134.0 44.6 40.3 42.8 35.5 30.3
Other staff expense 132.5 92.5 90.1 66.0 60.4 52.0
Credit and collection services 112.5 101.6 84.9 66.7 70.3 64.6
Consulting and legal 101.2 113.0 112.6 81.0 57.4 91.1
Amortization of intangible assets 96.7 103.2 119.0 77.6 64.5 58.9
Postage and delivery 93.2 92.7 85.4 69.8 69.0 69.4
Communications 79.0 72.9 79.2 67.2 61.3 64.8
Visa litigation 76.9 -----
Operating supplies 48.7 54.0 53.2 46.8 39.8 46.8
FDIC premiums 22.4 22.6 23.1 19.5 18.0 17.4
Other real estate expense/(income) 15.8 0.2 (1.2) (1.8) (2.0) (0.1)
Loss on extinguishment of debt 9.8 11.7 ----
Merger expense -- 98.6 28.4 - 16.0
Other expense 377.3 347.5 341.0 297.0 219.2 180.4
Total noninterest expense $5,233.8 $4,879.9 $4,690.7 $3,897.0 $3,400.6 $3,219.4
Noninterest Expense
Noninterest expense increased by $353.9 million, or 7.3%, during 2007 compared to 2006. Primary factors contributing to
this increase included an increase in fraud losses, the Visa litigation expense recorded in the fourth quarter of 2007, an
increase in total personnel expense related to our election to record certain mortgage loans held for sale at fair value during
2007 under SFAS No. 159, and other staff expense due to severance costs associated with E2.
Operating losses over and short increased $89.4 million, primarily due to mortgage application fraud losses we incurred in
2007 from customer misstatements of income and/or assets primarily on Alt-A products originated in prior periods. We also
recorded a $76.9 million accrual for our proportionate share of certain Visa litigation. Despite recognizing this litigation cost,
we expect that gains from Visa’s initial public offering, which is anticipated to occur during the first half of 2008 subject to
market conditions, will be substantially greater than the litigation charges that we have recognized during 2007.
28