SunTrust 2007 Annual Report Download - page 106
Download and view the complete annual report
Please find page 106 of the 2007 SunTrust annual report below. You can navigate through the pages in the report by either clicking on the pages listed below, or by using the keyword search tool below to find specific information within the annual report.-
 1
1 -
2
-
3
-
4
-
5
-
6
-
7
-
8
-
9
-
10
-
11
-
12
-
13
-
14
-
15
-
16
-
17
-
18
-
19
-
20
-
21
-
22
-
23
-
24
-
25
-
26
-
27
-
28
-
29
-
30
-
31
-
32
-
33
-
34
-
35
-
36
-
37
-
38
-
39
-
40
-
41
-
42
-
43
-
44
-
45
-
46
-
47
-
48
-
49
-
50
-
51
-
52
-
53
-
54
-
55
-
56
-
57
-
58
-
59
-
60
-
61
-
62
-
63
-
64
-
65
-
66
-
67
-
68
-
69
-
70
-
71
-
72
-
73
-
74
-
75
-
76
-
77
-
78
-
79
-
80
-
81
-
82
-
83
-
84
-
85
-
86
-
87
-
88
-
89
-
90
-
91
-
92
-
93
-
94
-
95
-
 96
96 -
 97
97 -
 98
98 -
 99
99 -
 100
100 -
 101
101 -
 102
102 -
 103
103 -
 104
104 -
 105
105 -
 106
106 -
 107
107 -
 108
108 -
 109
109 -
 110
110 -
 111
111 -
 112
112 -
 113
113 -
 114
114 -
 115
115 -
 116
116 -
117
-
118
-
119
-
120
-
121
-
122
-
123
-
124
-
125
-
126
-
127
-
128
-
129
-
130
-
131
-
132
-
133
-
134
-
135
-
136
-
137
-
138
-
139
-
140
-
141
-
142
-
143
-
144
-
145
-
146
-
147
-
148
-
149
-
150
-
151
-
152
-
153
-
154
-
155
-
156
-
157
-
158
-
159
-
160
-
161
-
162
-
163
-
164
-
165
-
166
-
167
-
168
 |
 |

SUNTRUST BANKS, INC.
Notes to Consolidated Financial Statements (Continued)
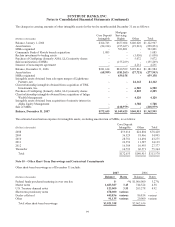
The Company maintains an active trading portfolio, carried at fair value, for balance sheet management purposes and
manages the potential market volatility of these securities with appropriate duration and/or hedging strategies. During 2007,
the Company replaced $4.6 billion of trading securities that were pledged as collateral with letters of credit issued by the
FHLB. The Company elected to record these letters of credit at fair value pursuant to the provisions of SFAS No. 159.
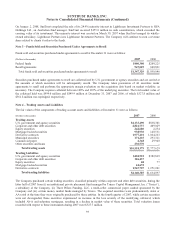
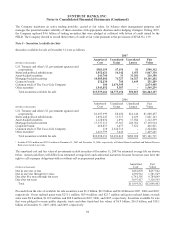
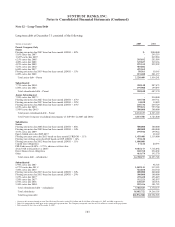
Note 5 – Securities Available for Sale
Securities available for sale at December 31 were as follows:
2007
(Dollars in thousands)
Amortized
Cost
Unrealized
Gains
Unrealized
Losses
Fair
Value
U.S. Treasury and other U.S. government agencies and
corporations $383,159 $7,154 $1 $390,312
States and political subdivisions 1,052,621 16,142 1,453 1,067,310
Asset-backed securities 241,700 33 31,383 210,350
Mortgage-backed securities 10,085,802 71,727 16,327 10,141,202
Corporate bonds 232,230 708 1,649 231,289
Common stock of The Coca-Cola Company 100 2,674,305 - 2,674,405
Other securities11,543,852 5,387 - 1,549,239
Total securities available for sale $13,539,464 $2,775,456 $50,813 $16,264,107
2006
(Dollars in thousands)
Amortized
Cost
Unrealized
Gains
Unrealized
Losses
Fair
Value
U.S. Treasury and other U.S. government agencies and
corporations $1,607,999 $8,602 $16,144 $1,600,457
States and political subdivisions 1,032,247 13,515 4,639 1,041,123
Asset-backed securities 1,128,032 1,891 17,584 1,112,339
Mortgage-backed securities 17,337,311 37,365 243,762 17,130,914
Corporate bonds 468,855 1,477 7,521 462,811
Common stock of The Coca-Cola Company 110 2,324,716 - 2,324,826
Other securities11,423,799 5,446 - 1,429,245
Total securities available for sale $22,998,353 $2,393,012 $289,650 $25,101,715
1Includes $792.4 million and $729.4 million at December 31, 2007 and December 31, 2006, respectively, of Federal Home Loan Bank and Federal Reserve
Bank stock stated at par value.
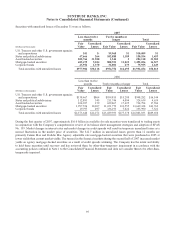
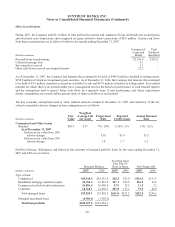
The amortized cost and fair value of investments in debt securities at December 31, 2007 by estimated average life are shown
below. Actual cash flows will differ from estimated average lives and contractual maturities because borrowers may have the
right to call or prepay obligations with or without call or prepayment penalties.
(Dollars in thousands)
Amortized
Cost
Fair
Value
Due in one year or less $461,878 $437,542
Due in one year through five years 1,694,912 1,701,529
Due after five years through ten years 6,741,305 6,784,849
Due after ten years 3,097,417 3,116,543
Total $11,995,512 $12,040,463
Proceeds from the sale of available for sale securities were $1.2 billion, $4.9 billion and $4.4 billion in 2007, 2006 and 2005,
respectively. Gross realized gains were $251.1 million, $69.4 million, and $21.7 million and gross realized losses on such
sales were $8.0 million, $119.9 million, and $28.8 million in 2007, 2006, and 2005, respectively. Securities available for sale
that were pledged to secure public deposits, trusts and other funds had fair values of $6.9 billion, $16.8 billion, and $18.1
billion at December 31, 2007, 2006, and 2005, respectively.
94