SunTrust 2007 Annual Report Download - page 70
Download and view the complete annual report
Please find page 70 of the 2007 SunTrust annual report below. You can navigate through the pages in the report by either clicking on the pages listed below, or by using the keyword search tool below to find specific information within the annual report.-
 1
1 -
2
-
3
-
4
-
5
-
6
-
7
-
8
-
9
-
10
-
11
-
12
-
13
-
14
-
15
-
16
-
17
-
18
-
19
-
20
-
21
-
22
-
23
-
24
-
25
-
26
-
27
-
28
-
29
-
30
-
31
-
32
-
33
-
34
-
35
-
36
-
37
-
38
-
39
-
40
-
41
-
42
-
43
-
44
-
45
-
46
-
47
-
48
-
49
-
50
-
51
-
52
-
53
-
54
-
55
-
56
-
57
-
58
-
59
-
 60
60 -
 61
61 -
 62
62 -
 63
63 -
 64
64 -
 65
65 -
 66
66 -
 67
67 -
 68
68 -
 69
69 -
 70
70 -
 71
71 -
 72
72 -
 73
73 -
 74
74 -
 75
75 -
 76
76 -
 77
77 -
 78
78 -
 79
79 -
 80
80 -
81
-
82
-
83
-
84
-
85
-
86
-
87
-
88
-
89
-
90
-
91
-
92
-
93
-
94
-
95
-
96
-
97
-
98
-
99
-
100
-
101
-
102
-
103
-
104
-
105
-
106
-
107
-
108
-
109
-
110
-
111
-
112
-
113
-
114
-
115
-
116
-
117
-
118
-
119
-
120
-
121
-
122
-
123
-
124
-
125
-
126
-
127
-
128
-
129
-
130
-
131
-
132
-
133
-
134
-
135
-
136
-
137
-
138
-
139
-
140
-
141
-
142
-
143
-
144
-
145
-
146
-
147
-
148
-
149
-
150
-
151
-
152
-
153
-
154
-
155
-
156
-
157
-
158
-
159
-
160
-
161
-
162
-
163
-
164
-
165
-
166
-
167
-
168
 |
 |

amount of tax and interest (if any) that might be assessed by a tax authority or the timing of an assessment or payment. It is
also not possible to reasonably predict whether or not the applicable statutes of limitations might run without us being
examined by any particular tax authority.
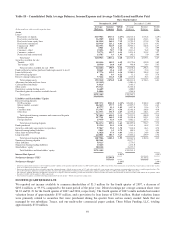
Table 17 – Selected Quarterly Financial Data
Three Months Ended
2007 2006
(Dollars in millions, except per share and other data) December 31 September 30 June 30 March 31 December 31 September 30 June 30 March 31
Summary of Operations
Interest, fees, and dividend income $2,448.7 $2,515.3 $2,543.9 $2,528.0 $2,564.7 $2,525.5 $2,423.1 $2,278.7
Interest expense 1,281.1 1,323.1 1,348.6 1,363.5 1,403.4 1,374.1 1,254.3 1,099.7
Net interest income 1,167.6 1,192.2 1,195.3 1,164.5 1,161.3 1,151.4 1,168.8 1,179.0
Provision for loan losses 356.8 147.0 104.7 56.4 115.8 61.6 51.8 33.4
Net interest income after provision for loan losses 810.8 1,045.2 1,090.6 1,108.1 1,045.5 1,089.8 1,117.0 1,145.6
Noninterest income1576.0 819.1 1,154.6 878.9 882.6 858.9 875.4 851.5
Noninterest expense 1,455.4 1,291.2 1,251.2 1,236.0 1,233.8 1,205.5 1,214.1 1,226.5
Income/(loss) before provision/(benefit) for income
taxes (68.6) 573.1 994.0 751.0 694.3 743.2 778.3 770.6
Provision/(benefit) for income taxes (79.7) 152.9 312.6 229.7 188.0 207.6 234.3 239.1
Net income 11.1 420.2 681.4 521.3 506.3 535.6 544.0 531.5
Preferred stock dividends 7.8 7.6 7.5 7.4 7.7 - - -
Net income available to common shareholders $3.3 $412.6 $673.9 $513.9 $498.6 $535.6 $544.0 $531.5
Net interest income-FTE $1,194.8 $1,219.2 $1,220.0 $1,188.3 $1,185.2 $1,173.9 $1,190.0 $1,199.4
Total revenue-FTE 1,770.8 2,038.3 2,374.6 2,067.2 2,067.8 2,032.8 2,065.4 2,050.9
Net income per average common share
Diluted $0.01 $1.18 $1.89 $1.44 $1.39 $1.47 $1.49 $1.46
Basic 0.01 1.19 1.91 1.45 1.41 1.48 1.51 1.48
Dividends paid per average common share 0.73 0.73 0.73 0.73 0.61 0.61 0.61 0.61
Selected Average Balances
Total assets $175,130.5 $174,653.4 $179,996.5 $181,506.4 $182,343.3 $180,500.9 $180,744.1 $177,618.3
Earning assets 151,541.0 152,327.6 157,594.2 159,473.6 160,114.8 158,914.7 158,888.8 155,742.9
Loans 121,094.3 119,558.6 118,164.6 121,514.9 121,363.8 120,742.0 120,144.5 116,262.3
Consumer and commercial deposits 99,648.5 96,707.6 97,926.3 97,792.3 98,552.9 97,642.5 97,172.3 95,292.4
Brokered and foreign deposits 15,717.0 21,139.9 23,983.4 26,714.1 26,124.2 27,958.3 27,194.3 24,651.7
Total shareholders’ equity 18,032.8 17,550.2 17,928.1 17,720.4 18,155.5 17,661.8 17,304.4 17,051.8
Financial Ratios and Other Data (Annualized)
Return on average total assets 0.03% 0.95% 1.52% 1.16% 1.10% 1.18% 1.21% 1.21%
Return on average assets less net unrealized securities
gains (0.01) 0.93 1.18 1.15 1.04 1.28 1.18 1.19
Return on average common shareholders’ equity 0.07 9.60 15.51 12.10 11.20 12.10 12.61 12.64
Return on average realized common shareholders’
equity (0.33) 9.86 12.71 12.54 11.17 13.73 12.90 13.06
Net interest margin- FTE 3.13 3.18 3.10 3.02 2.94 2.93 3.00 3.12
Efficiency ratio- FTE 82.19 63.35 52.69 59.79 59.67 59.30 58.78 59.80
Tangible efficiency ratio 80.86 62.13 51.64 58.65 58.49 58.03 57.53 58.47
Effective tax rate (116.22) 26.68 31.45 30.59 27.07 27.94 30.10 31.03
Allowance to period-end loans 1.05 0.91 0.88 0.88 0.86 0.90 0.88 0.88
Nonperforming assets to total loans plus OREO and
other repossessed assets 1.35 0.97 0.73 0.64 0.49 0.52 0.31 0.28
Common dividend payout ratio 7,788.6 61.6 38.5 50.6 43.3 41.1 40.9 41.6
Full-service banking offices 1,682 1,683 1,685 1,691 1,701 1,699 1,695 1,677
ATMs 2,507 2,518 2,533 2,543 2,569 2,568 2,564 2,786
Full-time equivalent employees 32,323 32,903 33,241 33,397 33,599 34,293 34,155 33,697
Tier 1 capital ratio 6.93% 7.44% 7.49% 7.60% 7.72% 7.70% 7.31% 7.26%
Total capital ratio 10.30 10.72 10.67 10.94 11.11 11.07 10.70 10.88
Tier 1 leverage ratio 6.90 7.28 7.11 7.24 7.23 7.27 6.82 6.71
Total average shareholders’ equity to average assets 10.30 10.05 9.96 9.76 9.96 9.78 9.57 9.60
Tangible equity to tangible assets 6.28 6.32 5.85 5.97 6.03 6.42 5.81 5.72
Book value per common share $50.38 $50.01 $48.33 $49.00 $48.78 $49.71 $47.85 $47.22
Market Price:
High 78.76 90.47 94.18 87.43 85.64 81.59 78.33 76.75
Low 60.02 73.61 78.16 80.76 76.76 75.11 72.56 69.68
Close 62.49 75.67 85.74 83.04 84.45 77.28 76.26 72.76
Market capitalization 21,772 26,339 29,928 29,604 29,972 28,120 27,768 26,437
Average common shares outstanding (000s)
Diluted 348,072 349,592 356,008 357,214 358,292 365,121 364,391 363,437
Basic 345,917 346,150 351,987 353,448 354,677 361,805 361,267 359,934
1Includes net securities gains/(losses)-in thousands $5,694.0 $991.0 $236,412.0 $20.0 $35,377.0 ($91,816.0) $5,858.0 $104.0
58