SunTrust 2007 Annual Report Download - page 143
Download and view the complete annual report
Please find page 143 of the 2007 SunTrust annual report below. You can navigate through the pages in the report by either clicking on the pages listed below, or by using the keyword search tool below to find specific information within the annual report.-
 1
1 -
2
-
3
-
4
-
5
-
6
-
7
-
8
-
9
-
10
-
11
-
12
-
13
-
14
-
15
-
16
-
17
-
18
-
19
-
20
-
21
-
22
-
23
-
24
-
25
-
26
-
27
-
28
-
29
-
30
-
31
-
32
-
33
-
34
-
35
-
36
-
37
-
38
-
39
-
40
-
41
-
42
-
43
-
44
-
45
-
46
-
47
-
48
-
49
-
50
-
51
-
52
-
53
-
54
-
55
-
56
-
57
-
58
-
59
-
60
-
61
-
62
-
63
-
64
-
65
-
66
-
67
-
68
-
69
-
70
-
71
-
72
-
73
-
74
-
75
-
76
-
77
-
78
-
79
-
80
-
81
-
82
-
83
-
84
-
85
-
86
-
87
-
88
-
89
-
90
-
91
-
92
-
93
-
94
-
95
-
96
-
97
-
98
-
99
-
100
-
101
-
102
-
103
-
104
-
105
-
106
-
107
-
108
-
109
-
110
-
111
-
112
-
113
-
114
-
115
-
116
-
117
-
118
-
119
-
120
-
121
-
122
-
123
-
124
-
125
-
126
-
127
-
128
-
129
-
130
-
131
-
132
-
 133
133 -
 134
134 -
 135
135 -
 136
136 -
 137
137 -
 138
138 -
 139
139 -
 140
140 -
 141
141 -
 142
142 -
 143
143 -
 144
144 -
 145
145 -
 146
146 -
 147
147 -
 148
148 -
 149
149 -
 150
150 -
 151
151 -
 152
152 -
 153
153 -
154
-
155
-
156
-
157
-
158
-
159
-
160
-
161
-
162
-
163
-
164
-
165
-
166
-
167
-
168
 |
 |
SUNTRUST BANKS, INC.
Notes to Consolidated Financial Statements (Continued)
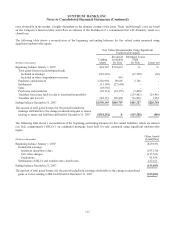
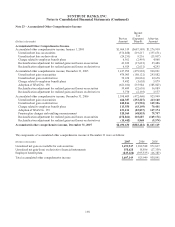
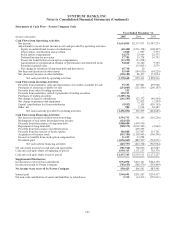
The following table presents financial assets and financial liabilities measured at fair value on a recurring basis and the change
in fair value for those specific financial instruments in which fair value has been elected. The table does not reflect the change in
fair value attributable to the related economic hedges the Company used to mitigate the interest rate risk associated with the
financial instruments. The changes in the fair value of economic hedges were also recorded in trading account profits/(losses)
and commissions or mortgage production related income, as appropriate, and substantially offset the change in fair value of the
financial instruments referenced in the table below. The Company’s economic hedging activities are deployed at both the
instrument and portfolio level.
Fair Value Measurements at
December 31, 2007, Using
Fair Value Gain/(Loss) for the Year
Ended December 31, 2007, for Items
Measured at Fair Value Pursuant to
Election of the Fair Value Option
(Dollars in thousands)
Assets/Liabilities
Measured at Fair
Value
December 31, 2007
Quoted
Prices In
Active
Markets
for
Identical
Assets
(Level 1)
Significant
Other
Observable
Inputs
(Level 2)
Significant
Unobservable
Inputs
(Level 3)
Trading Account
Profits and
Commissions
Mortgage
Production
Related
Income
Total
Changes in
Fair Values
Included in
Current-
Period
Earnings1
Assets
Trading assets $10,518,379 $294,412 $7,273,822 $2,950,145 ($151,695) $- ($151,695)
Securities available for sale 16,264,107 2,815,488 12,578,912 869,707 - - -
Loans held for sale 6,325,160 - 5,843,833 481,327 - 81,561281,561
Loans 220,784 - - 220,784 - (1,712) (1,712)
Liabilities
Brokered deposits 234,345 - 234,345 - 7,686 - 7,686
Trading liabilities 2,160,385 592,678 1,567,707 - - - -
Long-term debt 7,446,980 - 7,446,980 - (70,927) - (70,927)
Other liabilities, net 19,603 - - 19,603 - - -
1 Changes in fair value for the twelve months ended December 31, 2007 exclude accrued interest for the period then ended. Interest income or interest expense on trading
assets, loans held for sale, brokered deposits and long-term debt that have been elected to be carried at fair value under the provisions of SFAS No. 159 or SFAS No. 155 are
recorded in interest income or interest expense in the Consolidated Statements of Income based on their contractual coupons. Certain trading assets do not have a contractually
stated coupon and, for these securities, the Company records interest income based on the effective yield calculated upon acquisition of those securities. For the twelve
months ended December 31, 2007, the change in fair value related to accrued interest income on loans held for sale was an increase of $11.1 million and the change in fair
value related to accrued interest expense on brokered deposits and long-term debt was an increase of $8.7 million and a decrease of $29.1 million, respectively.
2 This amount includes $214.6 million related to MSR assets recognized upon the sale of the loans.
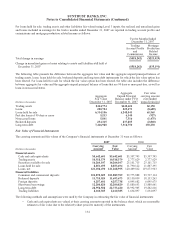
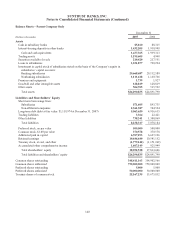
The following table presents the change in carrying value of those assets measured at fair value on a non-recurring basis, for
which impairment was recognized in the current period. The table does not reflect the change in fair value attributable to any
related economic hedges the Company used to mitigate the interest rate risk associated with these assets. With respect to loans
held for sale, the changes in fair value of the economic hedges were also recorded in mortgage production related income, and
substantially offset the change in fair value of the financial assets referenced in the table below. The Company’s economic
hedging activities are deployed at the portfolio level.
Fair Value Measurement at
December 31, 2007, Using
(Dollars in thousands)
Carrying
Value as of
December 31,
2007
Quoted
Prices In
Active
Markets
for
Identical
Assets
(Level 1)
Significant
Other
Observable
Inputs
(Level 2)
Significant
Unobservable
Inputs
(Level 3)
Valuation
Allowance as of
December 31, 2007
Loans Held for Sale1$1,476,425 $- $1,155,347 $321,078 ($81,054)
OREO2183,753 - 183,753 - (12,393)
Affordable Housing2544,160 - - 544,160 -
1These balances were not impacted by the election of the fair value option and are measured at fair value on a non-recurring basis in accordance with SFAS
No. 65.
2These balances were not impacted by the election of the fair value option and are measured at fair value on a non-recurring basis in accordance with SFAS
No. 144. There was a $63.4 million impairment recorded on Affordable Housing properties during 2007.
131