SunTrust 2007 Annual Report Download - page 149
Download and view the complete annual report
Please find page 149 of the 2007 SunTrust annual report below. You can navigate through the pages in the report by either clicking on the pages listed below, or by using the keyword search tool below to find specific information within the annual report.-
 1
1 -
2
-
3
-
4
-
5
-
6
-
7
-
8
-
9
-
10
-
11
-
12
-
13
-
14
-
15
-
16
-
17
-
18
-
19
-
20
-
21
-
22
-
23
-
24
-
25
-
26
-
27
-
28
-
29
-
30
-
31
-
32
-
33
-
34
-
35
-
36
-
37
-
38
-
39
-
40
-
41
-
42
-
43
-
44
-
45
-
46
-
47
-
48
-
49
-
50
-
51
-
52
-
53
-
54
-
55
-
56
-
57
-
58
-
59
-
60
-
61
-
62
-
63
-
64
-
65
-
66
-
67
-
68
-
69
-
70
-
71
-
72
-
73
-
74
-
75
-
76
-
77
-
78
-
79
-
80
-
81
-
82
-
83
-
84
-
85
-
86
-
87
-
88
-
89
-
90
-
91
-
92
-
93
-
94
-
95
-
96
-
97
-
98
-
99
-
100
-
101
-
102
-
103
-
104
-
105
-
106
-
107
-
108
-
109
-
110
-
111
-
112
-
113
-
114
-
115
-
116
-
117
-
118
-
119
-
120
-
121
-
122
-
123
-
124
-
125
-
126
-
127
-
128
-
129
-
130
-
131
-
132
-
133
-
134
-
135
-
136
-
137
-
138
-
 139
139 -
 140
140 -
 141
141 -
 142
142 -
 143
143 -
 144
144 -
 145
145 -
 146
146 -
 147
147 -
 148
148 -
 149
149 -
 150
150 -
 151
151 -
 152
152 -
 153
153 -
 154
154 -
 155
155 -
 156
156 -
 157
157 -
 158
158 -
 159
159 -
160
-
161
-
162
-
163
-
164
-
165
-
166
-
167
-
168
 |
 |

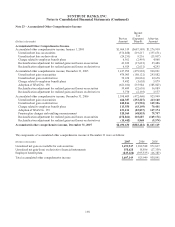
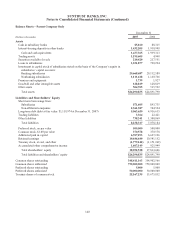
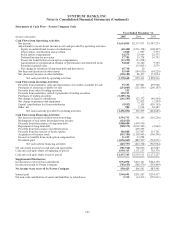
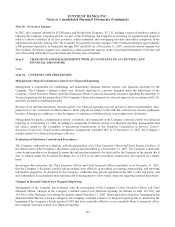
SUNTRUST BANKS, INC.
Notes to Consolidated Financial Statements (Continued)
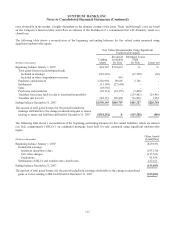
The application and development of management reporting methodologies is a dynamic process and is subject to periodic
enhancements. The implementation of these enhancements to the internal management reporting methodology may
materially affect the net income disclosed for each segment with no impact on consolidated amounts. Whenever significant
changes to management reporting methodologies take place, the impact of these changes is quantified and prior period
information is reclassified wherever practicable. The Company will reflect these reclassified changes in the current period
and will update historical results.
Twelve Months Ended December 31, 2007
(Dollars in thousands) Retail Commercial
Corporate
and
Investment
Banking Mortgage
Wealth and
Investment
Management
Corporate
Other and
Treasury
Reconciling
Items Consolidated
Average total assets $38,007,827 $35,415,346 $24,353,571 $45,554,333 $8,901,646 $23,980,022 $1,582,773 $177,795,518
Average total liabilities 69,087,135 19,164,955 9,207,334 2,718,817 10,434,428 49,278,490 96,346 159,987,505
Average total equity ----- -17,808,013 17,808,013
Net interest income $2,286,775 $870,321 $174,848 $527,079 $347,052 ($182,218) $695,687 $4,719,544
Fully taxable-equivalent adjustment (FTE) 136 37,144 47,481 - 54 17,837 28 102,680
Net interest income (FTE)12,286,911 907,465 222,329 527,079 347,106 (164,381) 695,715 4,822,224
Provision for loan losses2266,566 22,187 37,722 81,157 8,519 6,692 242,079 664,922
Net interest income after provision for loan losses 2,020,345 885,278 184,607 445,922 338,587 (171,073) 453,636 4,157,302
Noninterest income 1,103,873 298,564 377,980 365,746 807,955 498,363 (23,797) 3,428,684
Noninterest expense 2,181,804 721,215 489,762 823,793 1,008,603 32,329 (23,729) 5,233,777
Net income before taxes 942,414 462,627 72,825 (12,125) 137,939 294,961 453,568 2,352,209
Provision for income taxes3340,283 89,532 27,227 (20,053) 53,043 70,977 157,185 718,194
Net income $602,131 $373,095 $45,598 $7,928 $84,896 $223,984 $296,383 $1,634,015
Twelve Months Ended December 31, 2006
Retail Commercial
Corporate
and
Investment
Banking Mortgage
Wealth and
Investment
Management
Corporate
Other and
Treasury
Reconciling
Items Consolidated
Average total assets $37,772,328 $35,000,439 $23,881,973 $42,014,601 $8,933,309 $30,680,991 $2,031,505 $180,315,146
Average total liabilities 69,847,793 18,297,220 8,835,694 2,151,683 10,021,965 53,688,167 (74,116) 162,768,406
Average total equity ----- -17,546,740 17,546,740
Net interest income $2,344,972 $916,699 $203,132 $603,116 $369,484 ($145,682) $368,744 $4,660,465
Fully taxable-equivalent adjustment (FTE) 116 40,942 31,449 - 71 15,437 (49) 87,966
Net interest income (FTE)12,345,088 957,641 234,581 603,116 369,555 (130,245) 368,695 4,748,431
Provision for loan losses2105,985 9,701 113,933 8,748 3,696 4,076 16,397 262,536
Net interest income after provision for loan losses 2,239,103 947,940 120,648 594,368 365,859 (134,321) 352,298 4,485,895
Noninterest income 1,050,855 284,053 667,570 379,424 1,096,046 16,329 (25,905) 3,468,372
Noninterest expense 2,164,717 679,725 492,348 601,670 1,001,607 (36,246) (23,961) 4,879,860
Total contribution before taxes 1,125,241 552,268 295,870 372,122 460,298 (81,746) 350,354 3,074,407
Provision for income taxes3409,665 127,811 105,715 126,413 171,141 (105,611) 121,802 956,936
Net income $715,576 $424,457 $190,155 $245,709 $289,157 $23,865 $228,522 $2,117,471
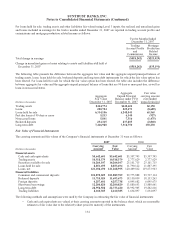
Twelve Months Ended December 31, 2005
Retail Commercial
Corporate
and
Investment
Banking Mortgage
Wealth and
Investment
Management
Corporate
Other and
Treasury
Reconciling
Items Consolidated
Average total assets $36,900,830 $33,127,140 $21,135,360 $33,031,775 $8,561,002 $32,810,621 $2,522,043 $168,088,771
Average total liabilities 65,897,208 17,042,341 8,617,720 1,871,113 9,937,605 48,391,891 (195,391) 151,562,487
Average total equity ----- -16,526,284 16,526,284
Net interest income $2,186,036 $865,541 $232,544 $554,542 $350,330 ($1,041) $391,014 $4,578,966
Fully taxable-equivalent adjustment (FTE) 83 37,722 22,484 - 64 15,138 1 75,492
Net interest income (FTE)12,186,119 903,263 255,028 554,542 350,394 14,097 391,015 4,654,458
Provision for loan losses2138,322 27,666 12,503 5,614 8,880 5,798 (21,897) 176,886
Net interest income after provision for loan losses 2,047,797 875,597 242,525 548,928 341,514 8,299 412,912 4,477,572
Noninterest income 1,020,119 270,528 636,349 239,299 942,466 76,818 (30,535) 3,155,044
Noninterest expense 2,048,975 670,006 478,543 516,328 932,559 74,863 (30,545) 4,690,729
Total contribution before taxes 1,018,941 476,119 400,331 271,899 351,421 10,254 412,922 2,941,887
Provision for income taxes3378,760 103,833 151,835 92,003 133,031 (57,247) 152,433 954,648
Net income $640,181 $372,286 $248,496 $179,896 $218,390 $67,501 $260,489 $1,987,239
1 Net interest income is fully taxable equivalent and is presented on a matched maturity funds transfer price basis for the line of business.
2 Provision for loan losses represents net charge-offs for the lines of business.
3 Includes regular income tax provision and taxable-equivalent income adjustment reversal.
137