SunTrust 2007 Annual Report Download - page 29
Download and view the complete annual report
Please find page 29 of the 2007 SunTrust annual report below. You can navigate through the pages in the report by either clicking on the pages listed below, or by using the keyword search tool below to find specific information within the annual report.-
 1
1 -
2
-
3
-
4
-
5
-
6
-
7
-
8
-
9
-
10
-
11
-
12
-
13
-
14
-
15
-
16
-
17
-
18
-
 19
19 -
 20
20 -
 21
21 -
 22
22 -
 23
23 -
 24
24 -
 25
25 -
 26
26 -
 27
27 -
 28
28 -
 29
29 -
 30
30 -
 31
31 -
 32
32 -
 33
33 -
 34
34 -
 35
35 -
 36
36 -
 37
37 -
 38
38 -
 39
39 -
40
-
41
-
42
-
43
-
44
-
45
-
46
-
47
-
48
-
49
-
50
-
51
-
52
-
53
-
54
-
55
-
56
-
57
-
58
-
59
-
60
-
61
-
62
-
63
-
64
-
65
-
66
-
67
-
68
-
69
-
70
-
71
-
72
-
73
-
74
-
75
-
76
-
77
-
78
-
79
-
80
-
81
-
82
-
83
-
84
-
85
-
86
-
87
-
88
-
89
-
90
-
91
-
92
-
93
-
94
-
95
-
96
-
97
-
98
-
99
-
100
-
101
-
102
-
103
-
104
-
105
-
106
-
107
-
108
-
109
-
110
-
111
-
112
-
113
-
114
-
115
-
116
-
117
-
118
-
119
-
120
-
121
-
122
-
123
-
124
-
125
-
126
-
127
-
128
-
129
-
130
-
131
-
132
-
133
-
134
-
135
-
136
-
137
-
138
-
139
-
140
-
141
-
142
-
143
-
144
-
145
-
146
-
147
-
148
-
149
-
150
-
151
-
152
-
153
-
154
-
155
-
156
-
157
-
158
-
159
-
160
-
161
-
162
-
163
-
164
-
165
-
166
-
167
-
168
 |
 |
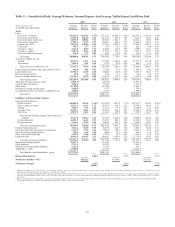
• Noninterest income decreased $39.7 million, or 1.1%, compared to 2006. The decrease was driven by $527.7
million of mark to market valuation losses related to the purchase of securities from (1) an institutional private
placement fund that we managed, (2) Three Pillars Funding, LLC, a multi-seller commercial paper conduit that we
sponsor and (3) certain money market funds that we manage. The acquired securities were predominantly AAA or
AA-rated at the time originally purchased by these entities. In the fourth quarter of 2007, while certain securities
were not downgraded, these securities experienced an increase in the loss severity of the underlying collateral,
which included Alt-A and subprime mortgages, resulting in a decline in market value of these securities. The
decrease in noninterest income was further impacted by market value declines in the mortgage loan warehouse and
securitization and trading assets. The impact of these valuation adjustments was substantially offset by the gain
recognized on the sale of shares of The Coca-Cola Company, the gain recognized on sale/leaseback transactions
related to premises, and the market valuation gain on our public debt and related hedges carried at fair value.
• Noninterest expense increased $353.9 million, or 7.3%, compared to 2006. The increase was primarily driven by an
increase in fraud losses, growth in compensation expense attributable to the election in 2007 to record certain
newly- originated mortgage loans held for sale at fair value, litigation expense related to our ownership in Visa,
Inc. (“Visa”), and severance expense incurred in association with E2.
• Provision for loan losses increased $402.4 million, or 153.3%, compared to 2006. The provision for loan losses
exceeded net charge-offs for the year by $242.1 million, primarily related to higher delinquencies and increased
charge-offs associated with residential real estate and home equity portfolios.
• Net charge-offs as a percentage of average loans was 0.35% for 2007, up 14 basis points from 2006. The increase
in net charge-offs was primarily related to residential real estate-related loans. Nonperforming assets increased
$1,061.7 million, compared to December 31, 2006, due primarily to the overall downturn in the housing market.
CONSOLIDATED RESULTS
Adoption of Fair Value Accounting Standards
During the first quarter of 2007, we evaluated the provisions of the recently issued fair value accounting standards, Statement
of Financial Accounting Standards (“SFAS”) No. 157, “Fair Value Measurement,” and SFAS No. 159, “The Fair Value
Option for Financial Assets and Financial Liabilities”. SFAS No. 157 clarifies how to measure fair value when such
measurement is otherwise required by US GAAP, and SFAS No. 159 provides companies with the option to elect to carry
specific financial assets and financial liabilities at fair value. The provisions of SFAS No. 157 establish clearer and more
consistent criteria for measuring fair value. The primary objective of SFAS No. 159 is to expand the use of fair value in
US GAAP, with the focus on eligible financial assets and financial liabilities. As a means to expand the use of fair value,
SFAS No. 159 allows companies to avoid some of the complexities of SFAS No. 133, “Accounting for Derivative
Instruments and Hedging Activities,” as amended by SFAS No. 149, and more closely align the economics of their business
with their results of operations without having to apply a mixed attribute accounting model for certain financial instruments
under a hedging relationship. Based on our evaluation of these standards in relation to our balance sheet management
strategies and objectives, we early adopted these fair value standards as of January 1, 2007. The following is a synopsis of
our thought process regarding how to apply SFAS No. 159 to our business:
• The prolonged and unprecedented inversion in the yield curve and continued shift in deposit mix to higher cost
products during the first quarter of 2007 resulted in further compression in net interest income and further
exacerbated the need for us to alter the size and composition of our balance sheet (i.e., smaller loan and securities
portfolio and larger trading portfolio).
• Recording financial assets and liabilities at fair value aligns with the active management of our balance sheet in
relation to varying market conditions.
• The accounting provisions of SFAS No. 159 permit companies to record existing and future financial assets and
financial liabilities at fair value and recognize changes in fair value through earnings, allowing for more active
hedging and/or trading of those assets and liabilities. SFAS No. 159 clarified a company’s ability to transfer
existing financial assets to trading assets without impacting the classification of future acquisitions of financial
assets.
17