SunTrust 2007 Annual Report Download - page 51
Download and view the complete annual report
Please find page 51 of the 2007 SunTrust annual report below. You can navigate through the pages in the report by either clicking on the pages listed below, or by using the keyword search tool below to find specific information within the annual report.-
 1
1 -
2
-
3
-
4
-
5
-
6
-
7
-
8
-
9
-
10
-
11
-
12
-
13
-
14
-
15
-
16
-
17
-
18
-
19
-
20
-
21
-
22
-
23
-
24
-
25
-
26
-
27
-
28
-
29
-
30
-
31
-
32
-
33
-
34
-
35
-
36
-
37
-
38
-
39
-
40
-
 41
41 -
 42
42 -
 43
43 -
 44
44 -
 45
45 -
 46
46 -
 47
47 -
 48
48 -
 49
49 -
 50
50 -
 51
51 -
 52
52 -
 53
53 -
 54
54 -
 55
55 -
 56
56 -
 57
57 -
 58
58 -
 59
59 -
 60
60 -
 61
61 -
62
-
63
-
64
-
65
-
66
-
67
-
68
-
69
-
70
-
71
-
72
-
73
-
74
-
75
-
76
-
77
-
78
-
79
-
80
-
81
-
82
-
83
-
84
-
85
-
86
-
87
-
88
-
89
-
90
-
91
-
92
-
93
-
94
-
95
-
96
-
97
-
98
-
99
-
100
-
101
-
102
-
103
-
104
-
105
-
106
-
107
-
108
-
109
-
110
-
111
-
112
-
113
-
114
-
115
-
116
-
117
-
118
-
119
-
120
-
121
-
122
-
123
-
124
-
125
-
126
-
127
-
128
-
129
-
130
-
131
-
132
-
133
-
134
-
135
-
136
-
137
-
138
-
139
-
140
-
141
-
142
-
143
-
144
-
145
-
146
-
147
-
148
-
149
-
150
-
151
-
152
-
153
-
154
-
155
-
156
-
157
-
158
-
159
-
160
-
161
-
162
-
163
-
164
-
165
-
166
-
167
-
168
 |
 |

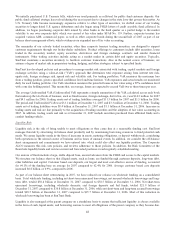
CAPITAL RESOURCES
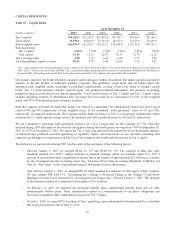
Table 13 – Capital Ratios
As of December 31
(Dollars in millions) 2007 2006 2005 2004 2003 2002
Tier 1 capital1$11,424.9 $12,524.7 $11,079.8 $9,783.7 $8,930.0 $8,106.1
Total capital 16,994.1 18,024.9 16,713.6 14,152.6 13,365.9 12,609.8
Risk-weighted assets 164,931.9 162,236.7 158,132.3 136,642.8 113,711.3 108,501.1
Risk-based ratios:
Tier 1 capital 6.93% 7.72% 7.01% 7.16% 7.85% 7.47%
Total capital 10.30 11.11 10.57 10.36 11.75 11.62
Tier 1 leverage ratio 6.90 7.23 6.65 6.64 7.37 7.30
Total shareholders’ equity to assets 10.05 9.78 9.40 10.06 7.76 7.47
1Tier 1 capital includes trust preferred obligations of $2.1 billion at the end of 2007, $2.4 billion at the end of 2006, $1.9 billion at the end of 2005 and
2004, and $1.7 billion at the end of 2003 and 2002. Tier 1 capital also includes qualifying minority interests in consolidated subsidiaries of $105 million at
the end of 2007, $455 million at the end of 2006, $467 million at the end of 2005, $451 million at the end of 2004, 2003 and 2002.
Our primary regulator, the Federal Reserve, measures capital adequacy within a framework that makes capital requirements
sensitive to the risk profiles of individual banking companies. The guidelines weigh assets and off balance sheet risk
exposures (risk weighted assets) according to predefined classifications, creating a base from which to compare capital
levels. Tier 1 Capital primarily includes realized equity and qualified preferred instruments, less purchase accounting
intangibles such as goodwill and core deposit intangibles. Total Capital consists of Tier 1 Capital and Tier 2 Capital, which
includes qualifying portions of subordinated debt, allowance for loan losses up to a maximum of 1.25% of risk weighted
assets, and 45% of the unrealized gain on equity securities.
Both the Company and SunTrust Bank (the “Bank”) are subject to a minimum Tier 1 Risk-Based Capital and Total Capital
ratios of 4% and 8%, respectively, of risk weighted assets. To be considered “well-capitalized,” ratios of 6% and 10%,
respectively, are required. Additionally, the Company and the Bank are subject to Tier 1 Leverage ratio requirements, which
measures Tier 1 Capital against average assets. The minimum and well-capitalized ratios are 3% and 5%, respectively.
We are committed to remaining well capitalized and have set a Tier 1 target ratio for the Company of 7.5%. This ratio
declined during 2007 with much of the decrease taking place during the fourth quarter moving from 7.44% at September 30,
2007 to 6.93% at December 31, 2007. We expect the Tier 1 ratio to be restored to the targeted level via the potential issuance
of enhanced trust preferred securities qualifying as regulatory capital, and transactions we are currently evaluating with
respect to our holdings of common stock in The Coca-Cola Company that would yield an increase in Tier 1 capital.
The decline in our capital ratios during 2007 was the result of the net impact of the following factors:
• Effective January 1, 2007, we adopted SFAS No. 157 and SFAS No. 159. The adoption of these fair value
standards resulted in a $399.5 million reduction in retained earnings, which was partially offset by a $147.4
increase in accumulated other comprehensive income due to the transfer of approximately $15.4 billion in available
for sale investment securities to trading assets. See “Adoption of Fair Value Accounting Standards” in MD&A and
Note 20, “Fair Value,” to the Consolidated Financial Statements for more information.
• Also effective January 1, 2007, we adopted FIN 48 which resulted in a reduction of total equity of $41.9 million.
We also adopted FSP FAS 13-2, ”Accounting for a Change or Projected Change in the Timing of Cash Flows
Relating to Income Taxes Generated by a Leveraged Lease Transaction,” effective January 1, 2007. The adoption
of this standard resulted in a reduction of total equity of $26.3 million.
• On February 13, 2007, we amended our retirement benefits plans, supplemental benefits plans and our other
postretirement welfare plans. These amendments resulted in a remeasurement of our plans’ obligations and
increased accumulated other comprehensive income by $79.7 million.
• On July 6, 2007, we repaid $250.0 million of Tier 1 qualifying, junior subordinated debentures held by a trust that
had an original maturity date of June 15, 2027.
39