SunTrust 2007 Annual Report Download - page 72
Download and view the complete annual report
Please find page 72 of the 2007 SunTrust annual report below. You can navigate through the pages in the report by either clicking on the pages listed below, or by using the keyword search tool below to find specific information within the annual report.-
 1
1 -
2
-
3
-
4
-
5
-
6
-
7
-
8
-
9
-
10
-
11
-
12
-
13
-
14
-
15
-
16
-
17
-
18
-
19
-
20
-
21
-
22
-
23
-
24
-
25
-
26
-
27
-
28
-
29
-
30
-
31
-
32
-
33
-
34
-
35
-
36
-
37
-
38
-
39
-
40
-
41
-
42
-
43
-
44
-
45
-
46
-
47
-
48
-
49
-
50
-
51
-
52
-
53
-
54
-
55
-
56
-
57
-
58
-
59
-
60
-
61
-
 62
62 -
 63
63 -
 64
64 -
 65
65 -
 66
66 -
 67
67 -
 68
68 -
 69
69 -
 70
70 -
 71
71 -
 72
72 -
 73
73 -
 74
74 -
 75
75 -
 76
76 -
 77
77 -
 78
78 -
 79
79 -
 80
80 -
 81
81 -
 82
82 -
83
-
84
-
85
-
86
-
87
-
88
-
89
-
90
-
91
-
92
-
93
-
94
-
95
-
96
-
97
-
98
-
99
-
100
-
101
-
102
-
103
-
104
-
105
-
106
-
107
-
108
-
109
-
110
-
111
-
112
-
113
-
114
-
115
-
116
-
117
-
118
-
119
-
120
-
121
-
122
-
123
-
124
-
125
-
126
-
127
-
128
-
129
-
130
-
131
-
132
-
133
-
134
-
135
-
136
-
137
-
138
-
139
-
140
-
141
-
142
-
143
-
144
-
145
-
146
-
147
-
148
-
149
-
150
-
151
-
152
-
153
-
154
-
155
-
156
-
157
-
158
-
159
-
160
-
161
-
162
-
163
-
164
-
165
-
166
-
167
-
168
 |
 |

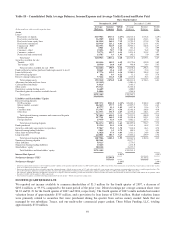
Fully taxable-equivalent net interest income was $1,194.8 million for the fourth quarter of 2007, an increase of $9.6 million,
or 0.8%, from the fourth quarter of 2006. The increase was the result of continued balance sheet management strategies we
implemented during the year. While net interest margin grew from 2.94% for the fourth quarter of 2006 to 3.13% for the
same period of 2007, we experienced a decline of 5 basis points from third quarter of 2007. Deposit pricing pressures along
with declines in earning asset yields drove the decline, partially offset by the benefit of lower wholesale funding costs.
Provision for loan losses was $356.8 million in the fourth quarter of 2007, an increase of $241.0 million from the fourth
quarter of 2006. The provision for loan losses was $188.8 million more than net charge-offs for the fourth quarter of 2007,
reflecting the downturn in the residential real estate markets and deteriorating credit conditions of the residential mortgage
and home equity portfolios.
Total noninterest income was $576.0 million for the fourth quarter of 2007, a decrease of $306.5 million, or 34.7%, from the
fourth quarter of 2006. This decrease was driven by the negative impact of the turmoil in the capital markets. In addition to
the net mark-to-market valuation losses related to the purchase of certain securities described above, we also experienced net
market value declines of approximately $45 million in the mortgage loan warehouse and securitization and trading assets, net
of positive valuations on our debt carried at fair value. These market valuation losses drove our trading account profits down
$446.7 million compared to the fourth quarter of 2006. Mortgage-related income increased $23.3 million, or 41.2%,
compared to the fourth quarter of 2006 due to higher servicing income generated from the servicing portfolio, which
increased over 15% in 2007, and a $19.2 million gain on sale of MSRs. Mortgage-related income is also estimated to have
increased approximately $34 million due to our election to record at fair value certain newly-originated mortgage loans held
for sale. Investment banking income decreased $16.2 million, or 22.7%, due to lower securitization and syndicated finance
activities. Compared to the fourth quarter of 2006, service charges on deposit accounts, card fees, and retail investment
services income each grew in excess of 10%. We also recognized a net gain of $118.8 million from the sale/leaseback of
branch and office properties.
Net securities gains/(losses) for the fourth quarter of 2007 also decreased by $29.7 million, or 83.9%, compared to the same
period of 2006. This was due to gains realized on equity positions we sold in the fourth quarter of 2006, partially offset by a
$24.3 million loss resulting from the restructuring of the bond portfolio in the same period.
Total noninterest expense was $1,455.4 million during the fourth quarter of 2007, an increase of $221.6 million, or 18.0%,
over the fourth quarter of 2006. This increase was driven primarily by the $76.9 million accrual for Visa litigation and $57.7
million in write-downs related to Affordable Housing properties. We are evaluating our strategic alternatives related to
Affordable Housing properties, including the possible sale of certain properties. We also incurred increased operating losses,
growing from $14.9 million for fourth quarter of 2006 to $42.8 million for the same period of 2007, due to mortgage
application fraud losses from customer misstatements of income and/or assets primarily on Alt-A products originated in prior
periods. Also impacting the fourth quarter of 2007 was an increase over 2006 of $25.7 million in employee compensation
expense, which was attributable to approximately $34 million of additional compensation expense related to our election in
2007 to record at fair value certain newly-originated mortgage loans held for sale.
The income tax benefit for the fourth quarter of 2007 was $79.7 million compared to the income tax provision of $187.9
million for the fourth quarter of 2006. The tax benefit was the result of the lower than anticipated fourth quarter earnings.
BUSINESS SEGMENTS
In 2007, we had five primary lines of business (“LOBs”): Retail, Commercial, Corporate and Investment Banking (“CIB”),
Wealth and Investment Management, and Mortgage. In this section, the Company discusses the performance and financial
results of those business segments. Looking forward to 2008, we will combine Commercial and Retail segments into one
segment and move the commercial real estate group into the Wholesale segment, formerly known as Corporate and
Investment Banking. These changes are being implemented in conjunction with the restructuring of the business client model
to better meet client needs. For more financial details on business segment disclosures, see Note 22 “Business Segment
Reporting,” to the Consolidated Financial Statements.
Retail
The Retail line of business includes loans, deposits, and other fee-based services for consumers and business clients with less
than $5 million in sales (up to $10 million in sales in larger metropolitan markets). Retail serves clients through an extensive
network of traditional and in-store branches, ATMs, the Internet (www.suntrust.com) and the telephone
60