SunTrust 2007 Annual Report Download - page 59
Download and view the complete annual report
Please find page 59 of the 2007 SunTrust annual report below. You can navigate through the pages in the report by either clicking on the pages listed below, or by using the keyword search tool below to find specific information within the annual report.-
 1
1 -
2
-
3
-
4
-
5
-
6
-
7
-
8
-
9
-
10
-
11
-
12
-
13
-
14
-
15
-
16
-
17
-
18
-
19
-
20
-
21
-
22
-
23
-
24
-
25
-
26
-
27
-
28
-
29
-
30
-
31
-
32
-
33
-
34
-
35
-
36
-
37
-
38
-
39
-
40
-
41
-
42
-
43
-
44
-
45
-
46
-
47
-
48
-
 49
49 -
 50
50 -
 51
51 -
 52
52 -
 53
53 -
 54
54 -
 55
55 -
 56
56 -
 57
57 -
 58
58 -
 59
59 -
 60
60 -
 61
61 -
 62
62 -
 63
63 -
 64
64 -
 65
65 -
 66
66 -
 67
67 -
 68
68 -
 69
69 -
70
-
71
-
72
-
73
-
74
-
75
-
76
-
77
-
78
-
79
-
80
-
81
-
82
-
83
-
84
-
85
-
86
-
87
-
88
-
89
-
90
-
91
-
92
-
93
-
94
-
95
-
96
-
97
-
98
-
99
-
100
-
101
-
102
-
103
-
104
-
105
-
106
-
107
-
108
-
109
-
110
-
111
-
112
-
113
-
114
-
115
-
116
-
117
-
118
-
119
-
120
-
121
-
122
-
123
-
124
-
125
-
126
-
127
-
128
-
129
-
130
-
131
-
132
-
133
-
134
-
135
-
136
-
137
-
138
-
139
-
140
-
141
-
142
-
143
-
144
-
145
-
146
-
147
-
148
-
149
-
150
-
151
-
152
-
153
-
154
-
155
-
156
-
157
-
158
-
159
-
160
-
161
-
162
-
163
-
164
-
165
-
166
-
167
-
168
 |
 |

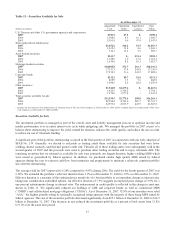
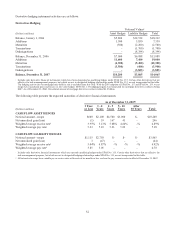
The December 31, 2007 net interest income sensitivity profiles include the impact from adopting SFAS No. 159.
Specifically, the net interest payments from $7.3 billion of receive fixed swaps are now reflected in trading income versus net
interest income. The benefit to net interest income due to a decline in short term interest rates will be recognized as a gain in
the fair value of the swaps and will be recorded as an increase in trading account profits and commissions. The recognition of
interest rate sensitivity from an economic perspective (above) is different from a financial reporting perspective (below) due
to the use of fair value accounting for these interest rate swaps and related underlying debt. Hence, the above profile includes
the recognition of the net interest payments from these swaps, while the profile below does not include the net interest
payments.
Financial Reporting Perspective
Rate Change
(Basis Points)
Estimated % Change in
Net Interest Income Over 12 Months
December 31, 2007 December 31, 2006
+100 0.1% (0.9%)
-100 (0.8%) 1.0%
We also perform valuation analysis, which is used for discerning levels of risk present in the balance sheet and derivative
positions that might not be taken into account in the net interest income simulation analysis. Whereas net interest income
simulation highlights exposures over a relatively short time horizon, valuation analysis incorporates all cash flows over the
estimated remaining life of all balance sheet and derivative positions. The valuation of the balance sheet, at a point in time, is
defined as the discounted present value of asset cash flows and derivative cash flows minus the discounted value of liability
cash flows, the net of which is referred to as EVE. The sensitivity of EVE to changes in the level of interest rates is a
measure of the longer-term repricing risk and options risk embedded in the balance sheet. Similar to the net interest income
simulation, EVE uses instantaneous changes in rates. EVE values only the current balance sheet and does not incorporate the
growth assumptions that are used in the net interest income simulation model. As with the net interest income simulation
model, assumptions about the timing and variability of balance sheet cash flows are critical in the EVE analysis. Particularly
important are the assumptions driving prepayments and the expected changes in balances and pricing of the indeterminate
deposit portfolios. As of December 31, 2007, the EVE profile indicates a negative change with respect to instantaneous 100
bp changes in rates due to the value sensitivity of MSRs.
Rate Shock
(Basis Points) Estimated % Change in EVE
December 31, 2007 December 31, 2006
+100 (2.8%) (5.5%)
-100 (1.2%) 3.6%
While an instantaneous and severe shift in interest rates is used in this analysis to provide an estimate of exposure under an
extremely adverse scenario, we believe that a gradual shift in interest rates would have a much more modest impact. Since
EVE measures the discounted present value of cash flows over the estimated lives of instruments, the change in EVE does
not directly correlate to the degree that earnings would be impacted over a shorter time horizon (i.e., the current fiscal year).
Further, EVE does not take into account factors such as future balance sheet growth, changes in product mix, changes in
yield curve relationships, and changing product spreads that could mitigate the adverse impact of changes in interest rates.
The net interest income simulation and valuation analyses EVE do not necessarily include certain actions that management
may undertake to manage this risk in response to anticipated changes in interest rates.
Trading Activities
In 2007, we evaluated various balance sheet management initiatives and implemented several changes to our asset/liability
management strategies. One of these changes was the expanded use of trading securities as part of our overall balance sheet
management. These trading securities were initially seeded by the transfer of approximately $16 billion in securities
previously classified as available for sale. Subsequent to the initial transfer as of January 1, 2007, we have continued to
actively manage a significant amount of trading securities as part of our asset and liability management strategies. We
purchased and classified as trading (and therefore measured at fair value through earnings) approximately $23 billion of
trading securities during the year subsequent to the initial transfer. The composition and duration of these securities has
changed over the course of the year in conjunction with changes to our asset and liability management strategies, as well as
changing market conditions.
47