SunTrust 2007 Annual Report Download - page 153
Download and view the complete annual report
Please find page 153 of the 2007 SunTrust annual report below. You can navigate through the pages in the report by either clicking on the pages listed below, or by using the keyword search tool below to find specific information within the annual report.-
 1
1 -
2
-
3
-
4
-
5
-
6
-
7
-
8
-
9
-
10
-
11
-
12
-
13
-
14
-
15
-
16
-
17
-
18
-
19
-
20
-
21
-
22
-
23
-
24
-
25
-
26
-
27
-
28
-
29
-
30
-
31
-
32
-
33
-
34
-
35
-
36
-
37
-
38
-
39
-
40
-
41
-
42
-
43
-
44
-
45
-
46
-
47
-
48
-
49
-
50
-
51
-
52
-
53
-
54
-
55
-
56
-
57
-
58
-
59
-
60
-
61
-
62
-
63
-
64
-
65
-
66
-
67
-
68
-
69
-
70
-
71
-
72
-
73
-
74
-
75
-
76
-
77
-
78
-
79
-
80
-
81
-
82
-
83
-
84
-
85
-
86
-
87
-
88
-
89
-
90
-
91
-
92
-
93
-
94
-
95
-
96
-
97
-
98
-
99
-
100
-
101
-
102
-
103
-
104
-
105
-
106
-
107
-
108
-
109
-
110
-
111
-
112
-
113
-
114
-
115
-
116
-
117
-
118
-
119
-
120
-
121
-
122
-
123
-
124
-
125
-
126
-
127
-
128
-
129
-
130
-
131
-
132
-
133
-
134
-
135
-
136
-
137
-
138
-
139
-
140
-
141
-
142
-
 143
143 -
 144
144 -
 145
145 -
 146
146 -
 147
147 -
 148
148 -
 149
149 -
 150
150 -
 151
151 -
 152
152 -
 153
153 -
 154
154 -
 155
155 -
 156
156 -
 157
157 -
 158
158 -
 159
159 -
 160
160 -
 161
161 -
 162
162 -
 163
163 -
164
-
165
-
166
-
167
-
168
 |
 |

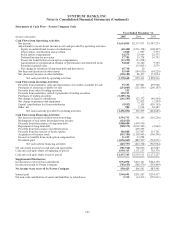
SUNTRUST BANKS, INC.
Notes to Consolidated Financial Statements (Continued)
Statements of Cash Flow – Parent Company Only
Year Ended December 31,
(Dollars in thousands) 2007 2006 2005
Cash Flows from Operating Activities:
Net income $1,634,015 $2,117,471 $1,987,239
Adjustments to reconcile net income to net cash provided by operating activities:
Equity in undistributed income of subsidiaries (65,428) (1,216,198) (308,407)
Depreciation, amortization and accretion 1,028 1,907 5,573
Stock option compensation 24,275 25,969 26,375
Deferred income tax provision 17,701 19,378 16,753
Excess tax benefits from stock option compensation (11,259) (33,258) -
Amortization of compensation element of performance and restricted stock 34,820 18,340 9,190
Securities (gains)/losses -(15,065) 2,979
Net change in valuation of long-term debt and derivatives 45,710 20 -
Net decrease/(increase) in other assets 15,960 (149,630) (54,220)
Net (decrease)/increase in other liabilities (318,182) 86,397 173,054
Net cash provided by operating activities 1,378,640 855,331 1,858,536
Cash Flows from Investing Activities:
Proceeds from maturities, calls and repayments of securities available for sale 37,355 307,801 299,968
Purchases of securities available for sale (214,005) (121,836) (200,187)
Proceeds from sales of trading securities 211 --
Proceeds from maturities, calls & repayments of trading securities 195,235 --
Purchases of trading securities (1,205,136) --
Net change in loans to subsidiaries (241,583) 123,372 (49,504)
Net change in premises and equipment -12,823 (1,290)
Capital contributions (to) from subsidiaries (9,812) 2,105 (530,355)
Other, net 904 1,014 56,683
Net cash (used in) provided by investing activities (1,436,831) 325,279 (424,685)
Cash Flows from Financing Activities:
Net increase (decrease) in short-term borrowings 1,594,733 351,149 (101,236)
Redemption of real estate investment trust security (424,923) --
Proceeds from the issuance of long-term debt 1,000,000 1,499,700 -
Repayment of long-term debt (900,572) (1,012,563) (9,062)
Proceeds from the issuance of preferred stock -492,295 -
Proceeds from the exercise of stock options 186,000 215,947 135,701
Acquisition of treasury stock (853,385) (1,105,043) (196,396)
Excess tax benefits from stock option compensation 11,259 33,258 -
Dividends paid (1,056,869) (887,297) (794,971)
Net cash used in financing activities (443,757) (412,554) (965,964)
Net (decrease) increase in cash and cash equivalents (501,948) 768,056 467,887
Cash and cash equivalents at beginning of period 1,939,313 1,171,257 703,370
Cash and cash equivalents at end of period $1,437,365 $1,939,313 $1,171,257
Supplemental Disclosures:
Income taxes received from subsidiaries $734,078 $615,131 $644,350
Income taxes paid by Parent Company (703,653) (548,570) (558,409)
Net income taxes received by Parent Company $30,425 $66,561 $85,941
Interest paid $344,691 $291,267 $234,537
Net non-cash contribution of assets and liabilities to subsidiaries 5,312 (34,311) (325,631)
141