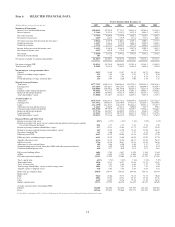
SunTrust 2007 Annual Report Download - page 31
Download and view the complete annual report
Please find page 31 of the 2007 SunTrust annual report below. You can navigate through the pages in the report by either clicking on the pages listed below, or by using the keyword search tool below to find specific information within the annual report.-
 1
1 -
2
-
3
-
4
-
5
-
6
-
7
-
8
-
9
-
10
-
11
-
12
-
13
-
14
-
15
-
16
-
17
-
18
-
19
-
20
-
 21
21 -
 22
22 -
 23
23 -
 24
24 -
 25
25 -
 26
26 -
 27
27 -
 28
28 -
 29
29 -
 30
30 -
 31
31 -
 32
32 -
 33
33 -
 34
34 -
 35
35 -
 36
36 -
 37
37 -
 38
38 -
 39
39 -
 40
40 -
 41
41 -
42
-
43
-
44
-
45
-
46
-
47
-
48
-
49
-
50
-
51
-
52
-
53
-
54
-
55
-
56
-
57
-
58
-
59
-
60
-
61
-
62
-
63
-
64
-
65
-
66
-
67
-
68
-
69
-
70
-
71
-
72
-
73
-
74
-
75
-
76
-
77
-
78
-
79
-
80
-
81
-
82
-
83
-
84
-
85
-
86
-
87
-
88
-
89
-
90
-
91
-
92
-
93
-
94
-
95
-
96
-
97
-
98
-
99
-
100
-
101
-
102
-
103
-
104
-
105
-
106
-
107
-
108
-
109
-
110
-
111
-
112
-
113
-
114
-
115
-
116
-
117
-
118
-
119
-
120
-
121
-
122
-
123
-
124
-
125
-
126
-
127
-
128
-
129
-
130
-
131
-
132
-
133
-
134
-
135
-
136
-
137
-
138
-
139
-
140
-
141
-
142
-
143
-
144
-
145
-
146
-
147
-
148
-
149
-
150
-
151
-
152
-
153
-
154
-
155
-
156
-
157
-
158
-
159
-
160
-
161
-
162
-
163
-
164
-
165
-
166
-
167
-
168
 |
 |
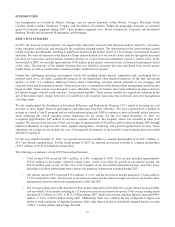
The persistent challenging economic environment, exacerbated by an uncertain outlook for meaningful improvement,
intensified in 2007 resulting in additional pressure on net interest income. While the yield curve steepened some in December
2006 and January 2007, the yield curve was again strongly inverted by the end of February 2007. Consequently, we
determined that it was appropriate to reduce the size of our balance sheet through a structured asset sale of approximately $2
billion of lower yielding, large corporate loans and also executed an additional $1.1 billion notional of receive-fixed interest
rate swaps on floating rate commercial loans. More significantly, we conducted a comprehensive review of our securities and
loan portfolios, whereby we analyzed a variety of the portfolios’ characteristics, including absolute size, overall liquidity,
customer collateral needs, credit and interest rate exposure, security type, and Tier 1 capital consumption. As a result, we
determined that it would be appropriate to significantly reduce the overall size of our securities and loan portfolios, as well as
to modify our asset/liability strategies to (1) reduce balance sheet utilization and related wholesale funding, (2) reduce risk
weighted assets for Tier 1 capital purposes, (3) reduce interest rate risk, (4) significantly reduce credit risk, (5) minimize
redundancy between the securities portfolio and the mortgage loan portfolio, (6) increase the overall portfolio yield,
(7) increase the use of derivatives to manage duration and (8) significantly reduce the size of the available for sale securities
portfolio and significantly increase the size of the trading securities portfolio.
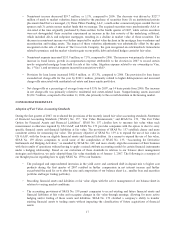
As discussed in Note 1, “Accounting Policies,” to the Consolidated Financial Statements, we early adopted the fair value
accounting standards SFAS No. 157 and SFAS No. 159. Shortly after the issuance of SFAS No. 157 in September 2006, we
began identifying positions that would be impacted by the provisions of SFAS No. 157. In connection with the evaluation of
SFAS No. 157, we also evaluated the draft provisions of SFAS No. 159. Generally, we support the elective use of fair value
of financial instruments, as evidenced by our early adoption in 2006 of SFAS No. 155. In certain circumstances, fair value
enables a company to more accurately align its financial performance with the market value of actively traded or hedged
assets or liabilities. Fair value enables a company to mitigate the non-economic earnings volatility caused from financial
assets and financial liabilities being carried at different bases of accounting, as well as to more accurately portray the active
and dynamic management of a company’s balance sheet. The objectives of the new fair value standards align closely with
our recent balance sheet management strategies.
Subsequent to the final issuance of SFAS No. 159 on February 15, 2007, we re-evaluated the provisions of SFAS No. 159
and the potential impacts of SFAS No. 157. In addition to the impact of SFAS No. 159 alleviating the burdens of fair value
hedge accounting on certain elements of our debt and loans held for sale, we also evaluated other potential impacts of the
final provisions of SFAS No. 159 related to our recently formulated asset/liability strategies that specifically related to the
investment and loan portfolios. The ability to record at fair value certain financial assets and liabilities resulted in us
accelerating the deployment of the various asset/liability strategies that we had been evaluating during the first quarter. After
an analysis of the potential impacts of these standards and discussions with our Board of Directors (the “Board”), we decided
in late March to early adopt both SFAS No. 157 and SFAS No. 159. The aggregate impact to the first quarter due to early
adopting these standards, including the related economic hedges, was a $60.8 million benefit to pre-tax income. The annual
financial impact from adopting these standards was considered by the Compensation Committee of the Board in connection
with the ordinary annual year-end review of our performance.
The most significant financial impacts of adopting the provisions of SFAS No. 157 related to valuing mortgage loans held for
sale and the recording of the valuation of mortgage loan commitments (related to loans intended to be held for sale) that are
derivatives under the provisions of SFAS No. 133, as amended by SFAS No. 149. Under SFAS No. 157, the fair value of a
closed loan includes the embedded cash flows that are ultimately realized as servicing value either through retention of the
servicing asset or through the sale of a loan on a servicing released basis. The valuation of loan commitments includes
assumptions related to the likelihood that a commitment will ultimately result in a closed loan. These pull-through rates are
based on our historical data, which is a significant unobservable assumption. Prior accounting requirements under EITF
02-03, “Accounting for Contracts involved in Energy Trading and Risk Managements Activities,” precluded the recognition
of any day one gains and losses if fair value was not based on market observable data. Rather, these deferred gains and losses
were recognized when the rate lock expired or when the underlying loan was ultimately sold. The change in valuation
methodology under SFAS No. 157 accelerates the recognition of these day one gains and losses. During the first quarter, we
recognized a $38.0 million reduction to mortgage production related income due to the acceleration of these day one losses
previously deferred. As a result of adopting SFAS No. 157, we recorded a $10.9 million reduction to opening retained
earnings.
In conjunction with adopting SFAS No. 159, we elected to record specific financial assets and financial liabilities at fair
value. These instruments include all, or a portion, of the following: debt, available for sale debt securities, adjustable rate
residential mortgage portfolio loans, securitization warehouses and trading loans. As a result of recording these financial
19