SunTrust 2007 Annual Report Download - page 46
Download and view the complete annual report
Please find page 46 of the 2007 SunTrust annual report below. You can navigate through the pages in the report by either clicking on the pages listed below, or by using the keyword search tool below to find specific information within the annual report.-
 1
1 -
2
-
3
-
4
-
5
-
6
-
7
-
8
-
9
-
10
-
11
-
12
-
13
-
14
-
15
-
16
-
17
-
18
-
19
-
20
-
21
-
22
-
23
-
24
-
25
-
26
-
27
-
28
-
29
-
30
-
31
-
32
-
33
-
34
-
35
-
 36
36 -
 37
37 -
 38
38 -
 39
39 -
 40
40 -
 41
41 -
 42
42 -
 43
43 -
 44
44 -
 45
45 -
 46
46 -
 47
47 -
 48
48 -
 49
49 -
 50
50 -
 51
51 -
 52
52 -
 53
53 -
 54
54 -
 55
55 -
 56
56 -
57
-
58
-
59
-
60
-
61
-
62
-
63
-
64
-
65
-
66
-
67
-
68
-
69
-
70
-
71
-
72
-
73
-
74
-
75
-
76
-
77
-
78
-
79
-
80
-
81
-
82
-
83
-
84
-
85
-
86
-
87
-
88
-
89
-
90
-
91
-
92
-
93
-
94
-
95
-
96
-
97
-
98
-
99
-
100
-
101
-
102
-
103
-
104
-
105
-
106
-
107
-
108
-
109
-
110
-
111
-
112
-
113
-
114
-
115
-
116
-
117
-
118
-
119
-
120
-
121
-
122
-
123
-
124
-
125
-
126
-
127
-
128
-
129
-
130
-
131
-
132
-
133
-
134
-
135
-
136
-
137
-
138
-
139
-
140
-
141
-
142
-
143
-
144
-
145
-
146
-
147
-
148
-
149
-
150
-
151
-
152
-
153
-
154
-
155
-
156
-
157
-
158
-
159
-
160
-
161
-
162
-
163
-
164
-
165
-
166
-
167
-
168
 |
 |

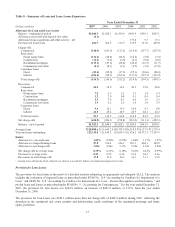
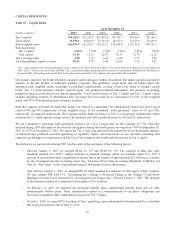
Net charge-offs for the year ended December 31, 2007 increased $176.7 million from the $246.1 million of net charge-offs
recorded in the prior year. The increase in net charge-offs was largely due to higher net charge-offs in the residential
mortgage and home equity portfolios. A downturn in residential real estate prices has negatively affected the entire industry.
Despite our avoidance of the subprime consumer real estate lending markets in our loan portfolio, the lower residential real
estate valuations have affected even borrowers of higher credit quality.
Table 9 – Nonperforming Assets and Accruing Loans Past Due 90 Days or More
As of December 31,
(Dollars in millions) 2007 2006 2005 2004 2003 2002
Nonperforming Assets
Nonaccrual loans
Commercial $74.5 $106.8 $70.9 $130.9 $165.9 $351.3
Real estate:
Construction 295.3 38.6 24.4 32.8 4.4 10.0
Residential mortgages1977.1 279.5 103.3 104.5 85.4 82.5
Commercial real estate 44.5 55.4 44.6 36.7 48.6 38.0
Consumer loans 39.0 23.5 28.7 49.3 32.2 29.2
Total nonaccrual loans 1,430.4 503.8 271.9 354.2 336.5 511.0
Restructured loans 29.9 28.0 24.4 19.1 14.8 -
Total nonperforming loans 1,460.3 531.8 296.3 373.3 351.3 511.0
Other real estate owned (“OREO”) 183.7 55.4 30.7 28.6 16.5 18.0
Other repossessed assets 11.5 6.6 7.2 8.8 10.3 13.0
Total nonperforming assets $1,655.5 $593.8 $334.2 $410.7 $378.1 $542.0
Ratios:
Nonperforming loans to total loans 1.19% 0.44% 0.26% 0.37% 0.44% 0.70%
Nonperforming assets to total loans plus OREO and other
repossessed assets 1.35 0.49 0.29 0.40 0.47 0.74
Accruing loans past due 90 days or more $611.0 $351.5 $371.5 $214.3 $196.4 $177.9
1Includes home equity loans.
Nonperforming Assets
Nonperforming assets, which consist of nonaccrual loans, restructured loans, other real estate owned (“OREO”) and other
repossessed assets totaled $1,655.5 million as of December 31, 2007, an increase of $1,061.7 million, or 179%, compared to
December 31, 2006.
Nonaccrual loans totaled $1,430.4 million as of December 31, 2007, an increase of $926.6 million, or 184%, compared to
December 31, 2006. The increase was primarily driven by residential mortgage loans, which increased by $697.6 million.
Nonaccrual real estate construction loans increased $256.7 million from December 31, 2006 to $295.3 million as of
December 31, 2007. The increase was largely driven by residential-related construction across the footprint.
Nonaccrual home equity lines of credit (“HELOC”) are classified in residential mortgages and were $135.8 million at
December 31, 2007 compared with $36.6 million at December 31, 2006. The increase was driven by HELOCs originated
through third-party channels, which accounted for 35% of nonperforming lines (excluding third party channels). There are no
HELOCs in the portfolio that were originated as sub prime. The average combined original LTV of the total HELOC
portfolio is approximately 74% and nearly 25% of the portfolio is in the first lien position. Approximately 23% of the
portfolio has combined LTVs greater than 90%, and the remainder of the portfolio has combined LTVs primarily in the
60%-85% range.
When a loan is placed on nonaccrual, unpaid interest is reversed against interest income. If interest payments are being made
by borrowers on nonaccrual loans, the interest is either recorded using the cash basis method of accounting or recognized at
the end of the loan after the principal has been reduced to zero, depending on the type of loan. If and when a nonaccrual loan
is returned to accruing status, the accrued interest at the date the loan is placed on nonaccrual status, and foregone interest
34