SunTrust 2007 Annual Report Download - page 49
Download and view the complete annual report
Please find page 49 of the 2007 SunTrust annual report below. You can navigate through the pages in the report by either clicking on the pages listed below, or by using the keyword search tool below to find specific information within the annual report.-
 1
1 -
2
-
3
-
4
-
5
-
6
-
7
-
8
-
9
-
10
-
11
-
12
-
13
-
14
-
15
-
16
-
17
-
18
-
19
-
20
-
21
-
22
-
23
-
24
-
25
-
26
-
27
-
28
-
29
-
30
-
31
-
32
-
33
-
34
-
35
-
36
-
37
-
38
-
 39
39 -
 40
40 -
 41
41 -
 42
42 -
 43
43 -
 44
44 -
 45
45 -
 46
46 -
 47
47 -
 48
48 -
 49
49 -
 50
50 -
 51
51 -
 52
52 -
 53
53 -
 54
54 -
 55
55 -
 56
56 -
 57
57 -
 58
58 -
 59
59 -
60
-
61
-
62
-
63
-
64
-
65
-
66
-
67
-
68
-
69
-
70
-
71
-
72
-
73
-
74
-
75
-
76
-
77
-
78
-
79
-
80
-
81
-
82
-
83
-
84
-
85
-
86
-
87
-
88
-
89
-
90
-
91
-
92
-
93
-
94
-
95
-
96
-
97
-
98
-
99
-
100
-
101
-
102
-
103
-
104
-
105
-
106
-
107
-
108
-
109
-
110
-
111
-
112
-
113
-
114
-
115
-
116
-
117
-
118
-
119
-
120
-
121
-
122
-
123
-
124
-
125
-
126
-
127
-
128
-
129
-
130
-
131
-
132
-
133
-
134
-
135
-
136
-
137
-
138
-
139
-
140
-
141
-
142
-
143
-
144
-
145
-
146
-
147
-
148
-
149
-
150
-
151
-
152
-
153
-
154
-
155
-
156
-
157
-
158
-
159
-
160
-
161
-
162
-
163
-
164
-
165
-
166
-
167
-
168
 |
 |

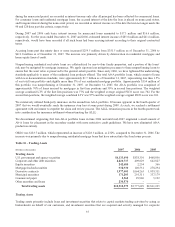
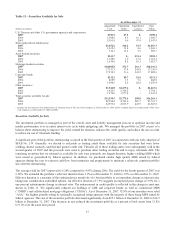
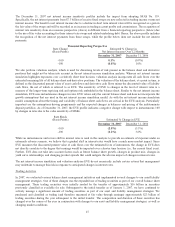
Table 11 – Securities Available for Sale
As of December 31
(Dollars in millions)
Amortized
Cost
Unrealized
Gains
Unrealized
Losses
Fair
Value
U.S. Treasury and other U.S. government agencies and corporations
2007 $383.2 $7.2 $- $390.4
2006 1,608.0 8.6 16.1 1,600.5
2005 2,593.8 0.6 47.4 2,547.0
States and political subdivisions
2007 $1,052.6 $16.2 $1.5 $1,067.3
2006 1,032.3 13.4 4.6 1,041.1
2005 914.1 15.5 3.9 925.7
Asset-backed securities
2007 $241.7 $- $31.4 $210.3
2006 1,128.0 1.9 17.6 1,112.3
2005 1,630.8 8.2 26.3 1,612.7
Mortgage-backed securities
2007 $10,085.8 $71.7 $16.3 $10,141.2
2006 17,337.3 37.4 243.8 17,130.9
2005 17,354.5 11.6 343.5 17,022.6
Corporate bonds
2007 $232.2 $0.7 $1.6 $231.3
2006 468.9 1.5 7.6 462.8
2005 1,090.6 2.6 22.8 1,070.4
Other securities1
2007 $1,544.0 $2,679.6 $- $4,223.6
2006 1,423.9 2,330.2 - 3,754.1
2005 1,370.0 1,977.4 - 3,347.4
Total securities available for sale
2007 $13,539.5 $2,775.4 $50.8 $16,264.1
2006 22,998.4 2,393.0 289.7 25,101.7
2005 24,953.8 2,015.9 443.9 26,525.8
1Includes our investment in 43.6 million shares of common stock of The Coca-Cola Company as of December 31, 2007 and 48.2 million shares of common stock of The Coca-
Cola Company as of December 31, 2006 and 2005.
Securities Available for Sale
The investment portfolio is managed as part of the overall asset and liability management process to optimize income and
market performance over an entire interest rate cycle while mitigating risk. We managed the portfolio in 2007 as part of a
balance sheet restructuring to improve the yield, extend the duration, enhance the credit quality, and reduce the size in order
to reduce our use of wholesale funding.
A significant part of the portfolio restructuring occurred in the first quarter of 2007 in conjunction with our early adoption of
SFAS No. 159. Generally, we elected to reclassify as trading assets those available for sale securities that were lower
yielding, shorter maturity, and that had greater credit risk. Virtually all of these trading assets were subsequently sold in the
second quarter of 2007 and the proceeds were used to purchase other trading securities and to repay wholesale debt. The
remaining securities that we retained as available for sale were primarily our longest duration, higher yielding MBS which
were issued or guaranteed by federal agencies. In addition, we purchased similar high quality MBS issued by federal
agencies during the year to reinvest cash-flow from maturities and prepayments to maintain a relatively constant portfolio
size after the restructuring.
The average yield for 2007 improved to 6.20% compared to 4.93% during 2006. The yield for the fourth quarter of 2007 was
6.18%. We extended the portfolio’s effective duration from 3.1% as of December 31, 2006 to 3.9% as of December 31, 2007.
Effective duration is a measure of the estimated price sensitivity of a bond portfolio to an immediate change in interest rates,
taking into consideration embedded options. An effective duration of 3.9% suggests an expected price change of 3.9% for a
one percent instantaneous change in interest rates. The enhancement in credit quality is reflected in the change in asset mix
shown in Table 11. We significantly reduced our holdings of ABS and corporate bonds, as well as commercial MBS
(“CMBS”) and collateralized mortgage obligations (“CMOs”). As of December 31, 2007, 92.8% of our securities were rated
“AAA,” the highest possible rating by nationally recognized rating agencies with the majority of these being MBS issued by
federal agencies. The size of the securities portfolio decreased significantly from $25.1 billion at December 31, 2006 to $16.3
billion at December 31, 2007. This decrease in size reduced the investment portfolio as a percent of total assets from 13.8%
to 9.1% over the same time period.
37