SunTrust 2007 Annual Report Download - page 90
Download and view the complete annual report
Please find page 90 of the 2007 SunTrust annual report below. You can navigate through the pages in the report by either clicking on the pages listed below, or by using the keyword search tool below to find specific information within the annual report.-
 1
1 -
2
-
3
-
4
-
5
-
6
-
7
-
8
-
9
-
10
-
11
-
12
-
13
-
14
-
15
-
16
-
17
-
18
-
19
-
20
-
21
-
22
-
23
-
24
-
25
-
26
-
27
-
28
-
29
-
30
-
31
-
32
-
33
-
34
-
35
-
36
-
37
-
38
-
39
-
40
-
41
-
42
-
43
-
44
-
45
-
46
-
47
-
48
-
49
-
50
-
51
-
52
-
53
-
54
-
55
-
56
-
57
-
58
-
59
-
60
-
61
-
62
-
63
-
64
-
65
-
66
-
67
-
68
-
69
-
70
-
71
-
72
-
73
-
74
-
75
-
76
-
77
-
78
-
79
-
 80
80 -
 81
81 -
 82
82 -
 83
83 -
 84
84 -
 85
85 -
 86
86 -
 87
87 -
 88
88 -
 89
89 -
 90
90 -
 91
91 -
 92
92 -
 93
93 -
 94
94 -
 95
95 -
 96
96 -
 97
97 -
 98
98 -
 99
99 -
 100
100 -
101
-
102
-
103
-
104
-
105
-
106
-
107
-
108
-
109
-
110
-
111
-
112
-
113
-
114
-
115
-
116
-
117
-
118
-
119
-
120
-
121
-
122
-
123
-
124
-
125
-
126
-
127
-
128
-
129
-
130
-
131
-
132
-
133
-
134
-
135
-
136
-
137
-
138
-
139
-
140
-
141
-
142
-
143
-
144
-
145
-
146
-
147
-
148
-
149
-
150
-
151
-
152
-
153
-
154
-
155
-
156
-
157
-
158
-
159
-
160
-
161
-
162
-
163
-
164
-
165
-
166
-
167
-
168
 |
 |

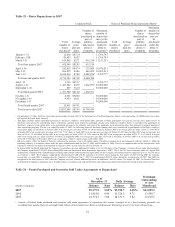
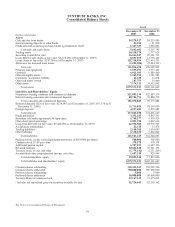
SUNTRUST BANKS, INC.
Consolidated Statements of Income
For the Twelve Months Ended December 31
(Dollars in thousands except per share data) 2007 2006 2005
Interest Income
Interest and fees on loans $7,979,281 $7,688,689 $5,961,122
Interest and fees on loans held for sale 668,939 727,991 485,724
Interest and dividends on securities available for sale
Taxable interest 516,289 1,022,888 1,032,785
Tax-exempt interest 43,158 39,357 35,733
Dividends1122,779 123,870 104,215
Interest on funds sold and securities purchased under agreements to resell 48,835 56,964 43,206
Interest on deposits in other banks 1,305 3,360 867
Trading account interest 655,334 128,901 67,657
Total interest income 10,035,920 9,792,020 7,731,309
Interest Expense
Interest on deposits 3,660,766 3,464,700 1,832,975
Interest on funds purchased and securities sold under agreements to repurchase 440,260 543,057 312,193
Interest on trading liabilities 15,586 15,540 11,878
Interest on other short-term borrowings 121,011 74,326 83,087
Interest on long-term debt 1,078,753 1,033,932 912,210
Total interest expense 5,316,376 5,131,555 3,152,343
Net Interest Income 4,719,544 4,660,465 4,578,966
Provision for loan losses 664,922 262,536 176,886
Net interest income after provision for loan losses 4,054,622 4,397,929 4,402,080
Noninterest Income
Service charges on deposit accounts 822,031 763,720 772,519
Trust and investment management income 685,034 686,865 673,720
Retail investment services 278,042 233,974 213,274
Other charges and fees 479,074 462,063 456,481
Card fees 280,706 247,647 210,779
Investment banking income 214,885 230,553 216,530
Trading account profits/(losses) and commissions (361,711) 113,047 145,120
Mortgage servicing related income 195,436 121,738 41,856
Mortgage production related income 90,983 217,428 144,885
Net gain on sale/leaseback of premises 118,840 --
Gain on sale upon merger of Lighthouse Partners 32,340 --
Net gain on sale of Bond Trustee business -112,759 -
Net gain on sale of RCM assets -- 23,382
Other noninterest income 349,907 329,055 263,653
Net securities gains/(losses) 243,117 (50,477) (7,155)
Total noninterest income 3,428,684 3,468,372 3,155,044
Noninterest Expense
Employee compensation 2,329,034 2,253,527 2,117,156
Employee benefits 441,154 471,926 417,055
Outside processing and software 410,945 393,576 357,387
Net occupancy expense 351,238 334,213 312,070
Equipment expense 206,498 197,038 204,038
Marketing and customer development 195,043 173,205 156,711
Amortization of intangible assets 96,680 103,226 118,964
Visa litigation 76,930 --
Loss on extinguishment of debt 9,800 11,665 -
Merger expense -- 98,642
Other noninterest expense 1,116,455 941,484 908,706
Total noninterest expense 5,233,777 4,879,860 4,690,729
Income before provision for income taxes 2,249,529 2,986,441 2,866,395
Provision for income taxes 615,514 868,970 879,156
Net income 1,634,015 2,117,471 1,987,239
Preferred stock dividends 30,275 7,729 -
Net Income Available to Common Shareholders $1,603,740 $2,109,742 $1,987,239
Net income per average common share
Diluted $4.55 $5.82 $5.47
Basic 4.59 5.87 5.53
Average common shares – diluted 352,688 362,802 363,454
Average common shares – basic 349,346 359,413 359,066
1Includes dividends on common stock of The Coca-Cola Company $60,915 $59,850 $54,058
See Notes to Consolidated Financial Statements.
78