SunTrust 2007 Annual Report Download - page 45
Download and view the complete annual report
Please find page 45 of the 2007 SunTrust annual report below. You can navigate through the pages in the report by either clicking on the pages listed below, or by using the keyword search tool below to find specific information within the annual report.-
 1
1 -
2
-
3
-
4
-
5
-
6
-
7
-
8
-
9
-
10
-
11
-
12
-
13
-
14
-
15
-
16
-
17
-
18
-
19
-
20
-
21
-
22
-
23
-
24
-
25
-
26
-
27
-
28
-
29
-
30
-
31
-
32
-
33
-
34
-
 35
35 -
 36
36 -
 37
37 -
 38
38 -
 39
39 -
 40
40 -
 41
41 -
 42
42 -
 43
43 -
 44
44 -
 45
45 -
 46
46 -
 47
47 -
 48
48 -
 49
49 -
 50
50 -
 51
51 -
 52
52 -
 53
53 -
 54
54 -
 55
55 -
56
-
57
-
58
-
59
-
60
-
61
-
62
-
63
-
64
-
65
-
66
-
67
-
68
-
69
-
70
-
71
-
72
-
73
-
74
-
75
-
76
-
77
-
78
-
79
-
80
-
81
-
82
-
83
-
84
-
85
-
86
-
87
-
88
-
89
-
90
-
91
-
92
-
93
-
94
-
95
-
96
-
97
-
98
-
99
-
100
-
101
-
102
-
103
-
104
-
105
-
106
-
107
-
108
-
109
-
110
-
111
-
112
-
113
-
114
-
115
-
116
-
117
-
118
-
119
-
120
-
121
-
122
-
123
-
124
-
125
-
126
-
127
-
128
-
129
-
130
-
131
-
132
-
133
-
134
-
135
-
136
-
137
-
138
-
139
-
140
-
141
-
142
-
143
-
144
-
145
-
146
-
147
-
148
-
149
-
150
-
151
-
152
-
153
-
154
-
155
-
156
-
157
-
158
-
159
-
160
-
161
-
162
-
163
-
164
-
165
-
166
-
167
-
168
 |
 |

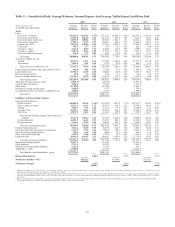
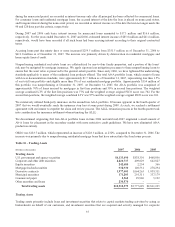
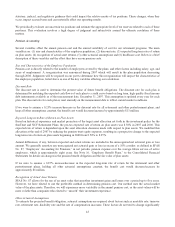
Table 8 – Summary of Loan and Lease Losses Experience
Year Ended December 31
(Dollars in millions) 2007 2006 2005 2004 2003 2002
Allowance for Loan and Lease Losses
Balance – beginning of period $1,044.5 $1,028.1 $1,050.0 $941.9 $930.1 $867.1
Allowance associated with loans at fair value1(4.1) - ----
Allowance from acquisitions and other activity – net -- - 173.8 9.3 15.5
Provision for loan losses 664.9 262.5 176.9 135.5 313.6 469.8
Charge-offs
Commercial (140.9) (183.5) (112.0) (114.6) (197.7) (297.0)
Real estate:
Home equity lines (116.2) (28.8) (24.5) (12.6) (5.8) (5.0)
Construction (12.2) (2.3) (6.0) (4.1) (0.8) (0.8)
Residential mortgages (113.1) (29.6) (22.8) (20.2) (16.3) (11.7)
Commercial real estate (2.1) (8.1) (3.1) (5.5) (5.6) (17.8)
Consumer loans:
Direct (23.4) (22.0) (37.2) (25.1) (28.6) (28.4)
Indirect (106.4) (82.3) (109.6) (133.9) (139.5) (129.4)
Total charge-offs (514.3) (356.6) (315.2) (316.0) (394.3) (490.1)
Recoveries
Commercial 24.2 30.0 36.3 49.9 39.8 28.8
Real estate:
Home equity lines 7.8 6.9 6.2 3.3 1.4 1.4
Construction 1.2 2.0 0.8 0.1 0.4 0.4
Residential mortgages 5.5 7.9 8.1 6.4 3.6 2.3
Commercial real estate 1.9 6.2 2.6 1.4 1.4 3.9
Consumer loans:
Direct 9.6 12.1 13.5 10.0 8.5 8.8
Indirect 41.3 45.4 48.9 43.7 28.1 22.2
Total recoveries 91.5 110.5 116.4 114.8 83.2 67.8
Net charge-offs (422.8) (246.1) (198.8) (201.2) (311.1) (422.3)
Balance – end of period $1,282.5 $1,044.5 $1,028.1 $1,050.0 $941.9 $930.1
Average loans $120,080.6 $119,645.2 $108,742.0 $86,214.5 $76,137.9 $71,270.4
Year-end loans outstanding 122,319.0 121,454.3 114,554.9 101,426.2 80,732.3 73,167.9
Ratios:
Allowance to year-end loans 1.05% 0.86% 0.90% 1.04% 1.17% 1.27%
Allowance to nonperforming loans 87.8 196.4 346.9 281.3 268.1 182.0
Allowance to net charge-offs 3.03x 4.24x 5.17x 5.22x 3.03x 2.20x
Net charge-offs to average loans 0.35% 0.21% 0.18% 0.23% 0.41% 0.59%
Provision to average loans 0.55 0.22 0.16 0.16 0.41 0.66
Recoveries to total charge-offs 17.8 31.0 36.9 36.3 21.1 13.8
1Amount removed from the ALLL related to our election to record $4.1 billion of residential mortgages at fair value.
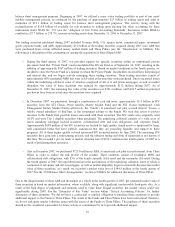
Provision for Loan Losses
The provision for loan losses is the result of a detailed analysis estimating an appropriate and adequate ALLL. The analysis
includes the evaluation of impaired loans as prescribed under SFAS No. 114 “Accounting by Creditors for Impairment of a
Loan,” and SFAS No. 118 “Accounting by Creditors for Impairment of a Loan – Income Recognition and Disclosures,” and
pooled loans and leases as prescribed under SFAS No. 5, “Accounting for Contingencies.” For the year ended December 31,
2007, the provision for loan losses was $664.9 million, an increase of $402.4 million, or 153%, from the year ended
December 31, 2006.
The provision for loan losses was $242.1 million more than net charge-offs of $422.8 million during 2007, reflecting the
downturn in the residential real estate markets and deteriorating credit conditions of the residential-mortgage and home
equity portfolios.
33