SunTrust 2007 Annual Report Download - page 44
Download and view the complete annual report
Please find page 44 of the 2007 SunTrust annual report below. You can navigate through the pages in the report by either clicking on the pages listed below, or by using the keyword search tool below to find specific information within the annual report.-
 1
1 -
2
-
3
-
4
-
5
-
6
-
7
-
8
-
9
-
10
-
11
-
12
-
13
-
14
-
15
-
16
-
17
-
18
-
19
-
20
-
21
-
22
-
23
-
24
-
25
-
26
-
27
-
28
-
29
-
30
-
31
-
32
-
33
-
 34
34 -
 35
35 -
 36
36 -
 37
37 -
 38
38 -
 39
39 -
 40
40 -
 41
41 -
 42
42 -
 43
43 -
 44
44 -
 45
45 -
 46
46 -
 47
47 -
 48
48 -
 49
49 -
 50
50 -
 51
51 -
 52
52 -
 53
53 -
 54
54 -
55
-
56
-
57
-
58
-
59
-
60
-
61
-
62
-
63
-
64
-
65
-
66
-
67
-
68
-
69
-
70
-
71
-
72
-
73
-
74
-
75
-
76
-
77
-
78
-
79
-
80
-
81
-
82
-
83
-
84
-
85
-
86
-
87
-
88
-
89
-
90
-
91
-
92
-
93
-
94
-
95
-
96
-
97
-
98
-
99
-
100
-
101
-
102
-
103
-
104
-
105
-
106
-
107
-
108
-
109
-
110
-
111
-
112
-
113
-
114
-
115
-
116
-
117
-
118
-
119
-
120
-
121
-
122
-
123
-
124
-
125
-
126
-
127
-
128
-
129
-
130
-
131
-
132
-
133
-
134
-
135
-
136
-
137
-
138
-
139
-
140
-
141
-
142
-
143
-
144
-
145
-
146
-
147
-
148
-
149
-
150
-
151
-
152
-
153
-
154
-
155
-
156
-
157
-
158
-
159
-
160
-
161
-
162
-
163
-
164
-
165
-
166
-
167
-
168
 |
 |
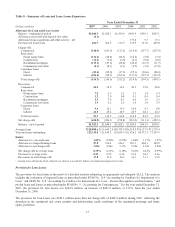
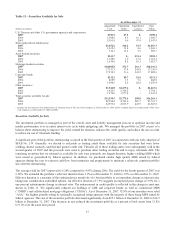
represented 1.05% of period-end loans. This compares with an ALLL of $1,044.5 million, or 0.86% of loans as of
December 31, 2006.
In addition to the review of credit quality through ongoing credit review processes, we employ a variety of modeling and
estimation tools for measuring credit risk that are used to construct an appropriate ALLL. Our ALLL framework has three
basic elements: specific allowances for loans individually evaluated for impairment, a formula-based component for pools of
homogeneous loans not individually evaluated, and an unallocated component that is based on other inherent risk factors and
imprecision associated with the modeling and estimation processes. This framework enables us to align loss estimation
practices with the different types of credit risk inherent in the loan portfolio.
The first element of the ALLL analysis involves the estimation of allowances specific to individual impaired loans. In this
process, specific allowances are established for nonaccruing loans greater than $2 million based on analysis of the most
probable sources of repayment, including discounted future cash flows, liquidation of collateral, or the market value of the
loan itself. As of December 31, 2007 and 2006, the specific allowance related to impaired loans totaled $17.5 million and
$17.4 million, respectively.
The second element of the ALLL, the general allowance for homogeneous loan pools not individually evaluated, is
determined by applying allowance factors to pools of loans within the portfolio that have similar risk characteristics. The
general allowance factors are determined using a baseline factor that is developed from an analysis of historical charge-off
experience and expected losses. Expected losses are based on estimated probabilities of default and loss given default derived
from an internal risk rating process. These baseline factors are developed and applied to the various loan pools. Adjustments
may be made to baseline reserves for some of the loan pools based on an assessment of internal and external influences on
credit quality not fully reflected in the historical loss or risk-rating data. These influences may include elements such as
changes in credit underwriting, concentration risk and/or recent observable asset quality trends. We continually evaluate our
ALLL methodology seeking to refine and enhance this process as appropriate, and it is likely that the methodology will
continue to evolve over time. As of December 31, 2007 and 2006, the general allowance calculations totaled $1,180.0 million
and $937.1 million, respectively. The increase was primarily due to deterioration in credit quality of the residential mortgage
and home equity portfolios. The increases to reserves associated with these were partially offset by lower ALLL factors
associated with the commercial and commercial real estate portfolios.
The third element of the ALLL is the unallocated reserve that addresses inherent losses not included elsewhere in the ALLL.
Qualitative factors of this third allowance element are subjective and require a high degree of management judgment. These
factors include the inherent imprecision in models and lagging or incomplete data. As of December 31, 2007 and 2006, the
ALLL estimated with respect to the third element totaled $85.0 million and $90.0 million, respectively.
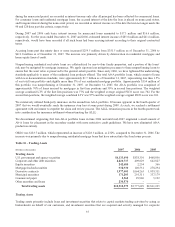
Our charge-off policy meets or exceeds regulatory minimums. Losses on unsecured consumer loans are recognized at 90
days past-due compared to the regulatory loss criteria of 120 days. Secured consumer loans, including residential real estate,
are typically charged-off between 120 and 180 days, depending on the collateral type, in compliance with FFIEC guidelines.
Commercial loans and real estate loans are typically placed on non-accrual when principal or interest is past-due for 90 days
or more unless the loan is both secured by collateral having realizable value sufficient to discharge the debt in-full and the
loan is in the legal process of collection. Accordingly, secured loans may be charged-down to the estimated value of the
collateral with previously accrued unpaid interest reversed. Subsequent charge-offs may be required as a result of changes in
the market value of collateral or other repayment prospects.
The ratio of the ALLL to total nonperforming loans decreased to 87.8% as of December 31, 2007 from 196.4% as of
December 31, 2006. The decline in this ratio was due to a $928.5 million increase in nonperforming loans driven primarily
by a $697.6 million increase in residential mortgage nonperforming loans. The increase in residential mortgage
nonperforming loans was driven primarily by deteriorating economic conditions including increased mortgage delinquency
rates and declining home values in most markets that we serve along with maturation of the portfolio.
In addition to reserves held in the ALLL, we had $7.9 million and $2.5 million in other liabilities as of December 31, 2007
and 2006, respectively, that represents a reserve against certain unfunded commitments, including letters of credit.
32