SunTrust 2007 Annual Report Download - page 50
Download and view the complete annual report
Please find page 50 of the 2007 SunTrust annual report below. You can navigate through the pages in the report by either clicking on the pages listed below, or by using the keyword search tool below to find specific information within the annual report.-
 1
1 -
2
-
3
-
4
-
5
-
6
-
7
-
8
-
9
-
10
-
11
-
12
-
13
-
14
-
15
-
16
-
17
-
18
-
19
-
20
-
21
-
22
-
23
-
24
-
25
-
26
-
27
-
28
-
29
-
30
-
31
-
32
-
33
-
34
-
35
-
36
-
37
-
38
-
39
-
 40
40 -
 41
41 -
 42
42 -
 43
43 -
 44
44 -
 45
45 -
 46
46 -
 47
47 -
 48
48 -
 49
49 -
 50
50 -
 51
51 -
 52
52 -
 53
53 -
 54
54 -
 55
55 -
 56
56 -
 57
57 -
 58
58 -
 59
59 -
 60
60 -
61
-
62
-
63
-
64
-
65
-
66
-
67
-
68
-
69
-
70
-
71
-
72
-
73
-
74
-
75
-
76
-
77
-
78
-
79
-
80
-
81
-
82
-
83
-
84
-
85
-
86
-
87
-
88
-
89
-
90
-
91
-
92
-
93
-
94
-
95
-
96
-
97
-
98
-
99
-
100
-
101
-
102
-
103
-
104
-
105
-
106
-
107
-
108
-
109
-
110
-
111
-
112
-
113
-
114
-
115
-
116
-
117
-
118
-
119
-
120
-
121
-
122
-
123
-
124
-
125
-
126
-
127
-
128
-
129
-
130
-
131
-
132
-
133
-
134
-
135
-
136
-
137
-
138
-
139
-
140
-
141
-
142
-
143
-
144
-
145
-
146
-
147
-
148
-
149
-
150
-
151
-
152
-
153
-
154
-
155
-
156
-
157
-
158
-
159
-
160
-
161
-
162
-
163
-
164
-
165
-
166
-
167
-
168
 |
 |

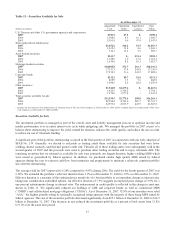
Net securities gains of $243.1 million were realized during 2007, primarily due to a $234.8 million gain from the sale in the
second quarter of 2007 of 4.5 million shares of our holdings of the common stock of The Coca-Cola Company. Net securities
losses realized for the year ended December 31, 2006 were $50.5 million, and $7.2 million for the year ended December 31,
2005.
The carrying value of the available for sale investment portfolio reflected $2.7 billion in net unrealized gains at December 31,
2007, substantially all of which related to unrealized gains on our investment in common stock of The Coca-Cola Company.
The net unrealized gain on the remaining portion of our holdings of this equity investment increased $349.6 million
compared to December 31, 2006 in addition to the $234.8 million gain realized on the sale discussed above. The net
unrealized gain on the remainder of the portfolio was $50.3 million, an improvement of $271.7 million compared to
December 31, 2006. These changes in market value did not affect our net income, but were included in other comprehensive
income. We review all of our securities with unrealized losses for other-than-temporary impairment at least quarterly. As a
result of these reviews in the fourth quarter of 2007, we determined that no impairment charges related to securities owned
with unrealized losses were deemed other than temporarily impaired this quarter since we have the present intent and ability
to retain these securities until recovery.
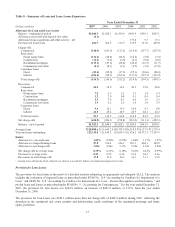
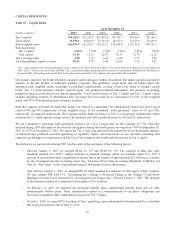
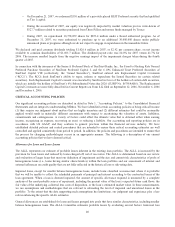
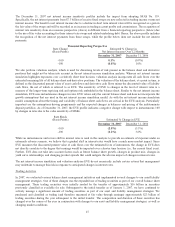
Table 12 – Composition of Average Deposits
Year Ended December 31 Percent of Total
(Dollars in millions) 2007 2006 2005 2007 2006 2005
Noninterest-bearing $21,677.2 $23,312.3 $24,315.0 18.1% 18.9% 22.0%
NOW accounts 20,042.8 17,214.4 17,213.7 16.7 13.9 15.6
Money market accounts 22,676.7 24,507.9 25,589.2 18.9 19.8 23.2
Savings 4,608.7 5,371.1 6,320.0 3.8 4.3 5.7
Consumer time 16,941.3 15,622.7 12,526.4 14.2 12.7 11.4
Other time 12,073.5 11,146.9 7,390.7 10.1 9.0 6.7
Total consumer and commercial deposits 98,020.2 97,175.3 93,355.0 81.8 78.6 84.6
Brokered deposits 16,091.9 17,425.7 10,182.2 13.4 14.1 9.2
Foreign deposits 5,764.5 9,064.5 6,869.3 4.8 7.3 6.2
Total deposits $119,876.6 $123,665.5 $110,406.5 100.0% 100.0% 100.0%
Deposits
Average consumer and commercial deposits increased during 2007 by $0.8 billion, or 0.9%, compared to 2006. The growth
was exclusively in higher cost NOW, consumer time and other time deposits, which increased $5.1 billion, or 11.5%, and
were offset by declines in money market, savings, and noninterest bearing DDA account balances. Money market accounts
declined $1.8 billion, or 7.5%, savings accounts declined $0.8 billion, or 14.2%, and noninterest bearing DDA account
balances declined $1.6 billion, or 7.0%. The decline in these products was the result of deposit migration to higher cost time
deposits as well as customers moving balances to alternative investments such as repurchase agreements or money market
mutual funds to take advantage of higher interest rates in response to the interest environment that prevailed during 2007.
Average brokered and foreign deposits decreased by $4.6 billion, or 17.5%, during 2007 compared to 2006. The decrease
was due to our efforts to reduce our reliance upon wholesale funding sources through balance sheet restructuring actions.
Consumer and commercial deposit growth is one of our key initiatives, as we focus on deposit gathering opportunities across
all lines business throughout the geographic footprint. We have instituted a number of initiatives to attract deposits including
the “My Cause” campaign which provides enrollment incentives to depositors, the modification of incentive plans to place
greater emphasis on deposit and package account sales, enhancing online banking products and partnering with other well
known brands in deposit oriented promotions. As of December 31, 2007 these efforts were successful in generating new
accounts and households, specifically, the “My Cause” campaign generated over 402,000 checking accounts. However, the
new accounts had not translated into higher overall deposit balances. As of December 31, 2007, securities pledged as
collateral for deposits totaled $6.9 billion.
38