SunTrust 2007 Annual Report Download - page 122
Download and view the complete annual report
Please find page 122 of the 2007 SunTrust annual report below. You can navigate through the pages in the report by either clicking on the pages listed below, or by using the keyword search tool below to find specific information within the annual report.-
 1
1 -
2
-
3
-
4
-
5
-
6
-
7
-
8
-
9
-
10
-
11
-
12
-
13
-
14
-
15
-
16
-
17
-
18
-
19
-
20
-
21
-
22
-
23
-
24
-
25
-
26
-
27
-
28
-
29
-
30
-
31
-
32
-
33
-
34
-
35
-
36
-
37
-
38
-
39
-
40
-
41
-
42
-
43
-
44
-
45
-
46
-
47
-
48
-
49
-
50
-
51
-
52
-
53
-
54
-
55
-
56
-
57
-
58
-
59
-
60
-
61
-
62
-
63
-
64
-
65
-
66
-
67
-
68
-
69
-
70
-
71
-
72
-
73
-
74
-
75
-
76
-
77
-
78
-
79
-
80
-
81
-
82
-
83
-
84
-
85
-
86
-
87
-
88
-
89
-
90
-
91
-
92
-
93
-
94
-
95
-
96
-
97
-
98
-
99
-
100
-
101
-
102
-
103
-
104
-
105
-
106
-
107
-
108
-
109
-
110
-
111
-
 112
112 -
 113
113 -
 114
114 -
 115
115 -
 116
116 -
 117
117 -
 118
118 -
 119
119 -
 120
120 -
 121
121 -
 122
122 -
 123
123 -
 124
124 -
 125
125 -
 126
126 -
 127
127 -
 128
128 -
 129
129 -
 130
130 -
 131
131 -
 132
132 -
133
-
134
-
135
-
136
-
137
-
138
-
139
-
140
-
141
-
142
-
143
-
144
-
145
-
146
-
147
-
148
-
149
-
150
-
151
-
152
-
153
-
154
-
155
-
156
-
157
-
158
-
159
-
160
-
161
-
162
-
163
-
164
-
165
-
166
-
167
-
168
 |
 |

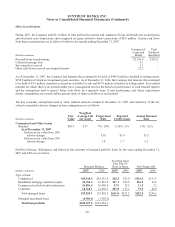
SUNTRUST BANKS, INC.
Notes to Consolidated Financial Statements (Continued)
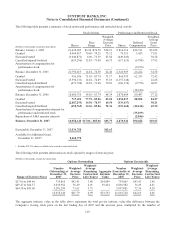
The following table presents a summary of stock option and performance and restricted stock activity:
Stock Options Performance and Restricted Stock
(Dollars in thousands except per share data) Shares
Price
Range
Weighted-
Average
Exercise
Price Shares
Deferred
Compensation
Weighted-
Average
Grant
Price
Balance, January 1, 2005 21,432,205 $6.96 -$76.50 $58.21 2,814,316 $36,511 $33.82
Granted 4,064,417 70.60 - 74.25 73.12 79,353 5,685 71.91
Exercised/vested (3,046,871) 6.96 - 73.19 45.86 (449,045) - 30.28
Cancelled/expired/forfeited (659,296) 12.85 - 73.40 66.75 (117,655) (6,784) 57.92
Amortization of compensation for
performance stock - - - - (9,190) -
Balance, December 31, 2005 21,790,455 14.18 - 76.50 62.46 2,326,969 26,222 34.58
Granted 956,106 71.03 - 83.74 71.17 860,959 62,355 72.42
Exercised/vested (3,594,131) 14.18 - 74.89 53.63 (1,157,148) - 22.68
Cancelled/expired/forfeited (471,720) 14.18 - 73.40 70.81 (160,176) (9,750) 60.87
Amortization of compensation for
performance stock - - - - (18,340) -
Balance, December 31, 2006 18,680,710 14.56 - 83.74 64.39 1,870,604 60,487 57.12
Granted 717,494 77.75 - 85.06 85.04 1,054,837 88,892 84.27
Exercised/vested (2,887,293) 14.56 - 78.39 60.50 (339,437) - 50.21
Cancelled/expired/forfeited (452,765) 14.56 - 85.06 72.36 (315,660) (20,612) 65.30
Amortization of compensation element for
performance and restricted stock - - - - (35,299) -
Repurchase of AMA member interests - - - - (2,846) -
Balance, December 31, 2007 16,058,146 $17.06 - $85.06 $65.79 2,270,344 $90,622 $69.63
Exercisable, December 31, 2007 11,834,728 $62.63
Available for Additional Grant,
December 31, 200718,460,772
1Includes 925,356 shares available to be issued as restricted stock.
The following table presents information on stock options by ranges of exercise price:
(Dollars in thousands, except per share data)
Options Outstanding Options Exercisable
Range of Exercise Prices
Number
Outstanding at
December 31,
2007
Weighted-
Average
Exercise
Price
Weighted-
Average
Remaining
Contractual
Life (Years)
Aggregate
Intrinsic
Value
Number
Exercisable at
December 31,
2007
Weighted-
Average
Exercise
Price
Weighted-
Average
Remaining
Contractual
Life (Years)
$17.06 to $49.46 739,865 $43.43 3.48 $14,099 739,865 $43.43 3.48
$49.47 to $64.57 6,036,982 56.49 4.01 39,454 6,036,982 56.49 4.01
$64.58 to $85.06 9,281,299 73.62 5.75 - 5,057,881 72.76 4.20
16,058,146 $65.79 4.99 $53,553 11,834,728 $62.63 4.06
The aggregate intrinsic value in the table above represents the total pre-tax intrinsic value (the difference between the
Company’s closing stock price on the last trading day of 2007 and the exercise price, multiplied by the number of
110