SunTrust 2007 Annual Report Download - page 28
Download and view the complete annual report
Please find page 28 of the 2007 SunTrust annual report below. You can navigate through the pages in the report by either clicking on the pages listed below, or by using the keyword search tool below to find specific information within the annual report.INTRODUCTION
Our headquarters are located in Atlanta, Georgia, and we operate primarily within Florida, Georgia, Maryland, North
Carolina, South Carolina, Tennessee, Virginia, and the District of Columbia. Within the geographic footprint, we operated
under five business segments during 2007. These business segments were: Retail, Commercial, Corporate and Investment
Banking, Wealth and Investment Management, and Mortgage.
EXECUTIVE SUMMARY
In 2007, the financial services industry was significantly affected by turmoil in the financial markets created by a downturn
in the consumer credit cycle, and specifically the residential housing market. The deterioration in the credit markets created
market volatility and illiquidity, resulting in significant declines in the market values of a broad range of investment products
and loans. We were not immune to the impacts of these market dynamics as our results clearly indicate through the increased
provision for loan losses and net market valuation declines of various financial instruments carried at market value. In the
second half of 2007, we recorded approximately $700 million in net market valuation losses on financial instruments carried
at fair value. The majority of the market valuation loss was related to securities that were purchased from certain money
market funds, as well as a multi-seller commercial paper conduit that we sponsor.
Despite this challenging operating environment, which also included intense deposit competition and a prolonged flat to
inverted yield curve, we made considerable progress in our shareholder value-oriented initiatives. In the first and second
quarters of 2007, we conducted additional balance sheet restructuring activities related primarily to our mortgage and
corporate loans and investment securities. These actions were a continuation of the balance sheet management initiatives that
began in 2006. These actions were designed to more efficiently utilize our balance sheet and resulted in an improvement in
net interest margin, reduced credit exposure, and increased liquidity. These actions resulted in a significant reduction in the
size of the balance sheet, change in the mix of available for sale securities, and an increase in the size and active management
of trading assets.
We also implemented the Excellence in Execution Efficiency and Productivity Program (“E2”) aimed at lowering our cost
structure to drive higher financial performance and enhancing long term efficiency. We have realized $215.2 million in
savings as a result of our E2program and are well positioned going into 2008 to continue to more efficiently utilize resources
while enhancing the overall customer service experience for our clients. For the year ended December 31, 2007, we
recognized approximately $45 million in severance expense related to this program, which was recorded in other staff
expense. We anticipate the run-rate of total cost savings of approximately $530 million will be achieved during 2009 through
initiatives identified in corporate real estate, supplier management, off-shoring, and process/organizational reviews. These
estimated cost savings do not include the cost of incremental investments or the benefit of non-recurring gains associated
with the E2initiatives.
For the year ended December 31, 2007, we reported net income available to common shareholders of $1,603.7 million, or
$4.55 per diluted common share. For the fourth quarter of 2007, we reported net income available to common shareholders
of $3.3 million, or $0.01 per diluted common share.
The following is a summary of our 2007 financial performance:
• Total revenue-FTE increased $34.1 million, or 0.4%, compared to 2006. Total revenue included approximately
$712.6 million in net market valuation related losses, which were offset by growth in net interest income, the
$234.8 million gain on sale of The Coca-Cola Company stock, fee-related noninterest income, and other gains,
including real estate related gains from various sale/leaseback transactions executed during 2007.
• Net interest income-FTE increased $73.8 million, or 1.6%, and the net interest margin increased 11 basis points to
3.11% compared to 2006. The increase in net interest income and net interest margin was due to our balance sheet
management initiatives that were implemented in 2006 and 2007.
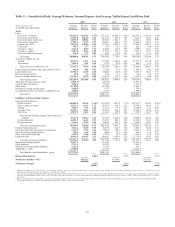
• The average earning asset yield increased 29 basis points compared to 2006 while the average interest bearing liability
cost increased 17 basis points, resulting in a 12 basis point increase in interest rate spread. Total average earning assets
decreased $3.2 billion, or 2.0%, to $155.2 billion during 2007, while total average customer deposits increased 844.9
million, or 0.9%, to $98.0 billion during 2007. Additionally, there was a shift in the mix of deposits to higher cost
products, with certificates of deposits increasing, while other deposit products, specifically demand deposit accounts
(“DDA”), money market, and savings, declined.
16


