SunTrust 2007 Annual Report Download - page 152
Download and view the complete annual report
Please find page 152 of the 2007 SunTrust annual report below. You can navigate through the pages in the report by either clicking on the pages listed below, or by using the keyword search tool below to find specific information within the annual report.-
 1
1 -
2
-
3
-
4
-
5
-
6
-
7
-
8
-
9
-
10
-
11
-
12
-
13
-
14
-
15
-
16
-
17
-
18
-
19
-
20
-
21
-
22
-
23
-
24
-
25
-
26
-
27
-
28
-
29
-
30
-
31
-
32
-
33
-
34
-
35
-
36
-
37
-
38
-
39
-
40
-
41
-
42
-
43
-
44
-
45
-
46
-
47
-
48
-
49
-
50
-
51
-
52
-
53
-
54
-
55
-
56
-
57
-
58
-
59
-
60
-
61
-
62
-
63
-
64
-
65
-
66
-
67
-
68
-
69
-
70
-
71
-
72
-
73
-
74
-
75
-
76
-
77
-
78
-
79
-
80
-
81
-
82
-
83
-
84
-
85
-
86
-
87
-
88
-
89
-
90
-
91
-
92
-
93
-
94
-
95
-
96
-
97
-
98
-
99
-
100
-
101
-
102
-
103
-
104
-
105
-
106
-
107
-
108
-
109
-
110
-
111
-
112
-
113
-
114
-
115
-
116
-
117
-
118
-
119
-
120
-
121
-
122
-
123
-
124
-
125
-
126
-
127
-
128
-
129
-
130
-
131
-
132
-
133
-
134
-
135
-
136
-
137
-
138
-
139
-
140
-
141
-
 142
142 -
 143
143 -
 144
144 -
 145
145 -
 146
146 -
 147
147 -
 148
148 -
 149
149 -
 150
150 -
 151
151 -
 152
152 -
 153
153 -
 154
154 -
 155
155 -
 156
156 -
 157
157 -
 158
158 -
 159
159 -
 160
160 -
 161
161 -
 162
162 -
163
-
164
-
165
-
166
-
167
-
168
 |
 |

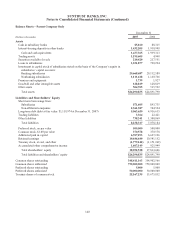
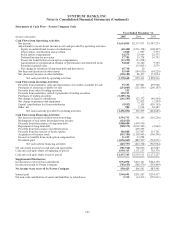
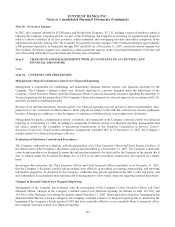
SUNTRUST BANKS, INC.
Notes to Consolidated Financial Statements (Continued)
Balance Sheets – Parent Company Only
December 31
(Dollars in thousands) 2007 2006
Assets
Cash in subsidiary banks $5,160 $8,315
Interest-bearing deposits in other banks 1,432,205 1,930,998
Cash and cash equivalents 1,437,365 1,939,313
Trading assets 1,195,605 4,948
Securities available for sale 210,420 217,551
Loans to subsidiaries 1,031,877 790,294
Investment in capital stock of subsidiaries stated on the basis of the Company’s equity in
subsidiaries’ capital accounts:
Banking subsidiaries 20,668,687 20,132,580
Nonbanking subsidiaries 1,111,618 1,160,766
Premises and equipment 1,739 1,927
Goodwill and other intangible assets 128,819 128,819
Other assets 504,705 515,592
Total assets $26,290,835 $24,891,790
Liabilities and Shareholders’ Equity
Short-term borrowings from:
Subsidiaries $71,605 $93,735
Non-affiliated companies 2,361,387 744,524
Long-term debt (debt at fair value: $1,118,974 at December 31, 2007) 5,063,620 4,916,635
Trading liabilities 3,364 22,421
Other liabilities 738,341 1,300,869
Total liabilities 8,238,317 7,078,184
Preferred stock, no par value 500,000 500,000
Common stock, $1.00 par value 370,578 370,578
Additional paid in capital 6,707,293 6,627,196
Retained earnings 10,646,640 10,541,152
Treasury stock, at cost, and other (1,779,142) (1,151,269)
Accumulated other comprehensive income 1,607,149 925,949
Total shareholders’ equity 18,052,518 17,813,606
Total liabilities and shareholders’ equity $26,290,835 $24,891,790
Common shares outstanding 348,411,163 354,902,566
Common shares authorized 750,000,000 750,000,000
Preferred shares outstanding 5,000 5,000
Preferred shares authorized 50,000,000 50,000,000
Treasury shares of common stock 22,167,235 15,675,832
140