SunTrust 2007 Annual Report Download - page 42
Download and view the complete annual report
Please find page 42 of the 2007 SunTrust annual report below. You can navigate through the pages in the report by either clicking on the pages listed below, or by using the keyword search tool below to find specific information within the annual report.-
 1
1 -
2
-
3
-
4
-
5
-
6
-
7
-
8
-
9
-
10
-
11
-
12
-
13
-
14
-
15
-
16
-
17
-
18
-
19
-
20
-
21
-
22
-
23
-
24
-
25
-
26
-
27
-
28
-
29
-
30
-
31
-
 32
32 -
 33
33 -
 34
34 -
 35
35 -
 36
36 -
 37
37 -
 38
38 -
 39
39 -
 40
40 -
 41
41 -
 42
42 -
 43
43 -
 44
44 -
 45
45 -
 46
46 -
 47
47 -
 48
48 -
 49
49 -
 50
50 -
 51
51 -
 52
52 -
53
-
54
-
55
-
56
-
57
-
58
-
59
-
60
-
61
-
62
-
63
-
64
-
65
-
66
-
67
-
68
-
69
-
70
-
71
-
72
-
73
-
74
-
75
-
76
-
77
-
78
-
79
-
80
-
81
-
82
-
83
-
84
-
85
-
86
-
87
-
88
-
89
-
90
-
91
-
92
-
93
-
94
-
95
-
96
-
97
-
98
-
99
-
100
-
101
-
102
-
103
-
104
-
105
-
106
-
107
-
108
-
109
-
110
-
111
-
112
-
113
-
114
-
115
-
116
-
117
-
118
-
119
-
120
-
121
-
122
-
123
-
124
-
125
-
126
-
127
-
128
-
129
-
130
-
131
-
132
-
133
-
134
-
135
-
136
-
137
-
138
-
139
-
140
-
141
-
142
-
143
-
144
-
145
-
146
-
147
-
148
-
149
-
150
-
151
-
152
-
153
-
154
-
155
-
156
-
157
-
158
-
159
-
160
-
161
-
162
-
163
-
164
-
165
-
166
-
167
-
168
 |
 |

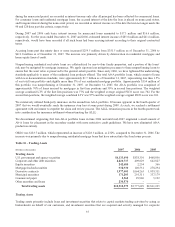
any future adjustments which may result from these examinations should not have a material effect on the Company’s
Consolidated Financial Statements.
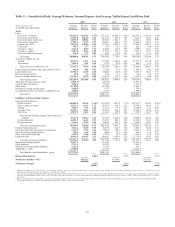
Table 5 – Loan Portfolio by Types of Loans
As of December 31
(Dollars in millions) 2007 2006 2005 2004 2003 2002
Commercial $35,929.4 $34,613.9 $33,764.2 $31,823.8 $30,681.9 $28,693.6
Real estate:
Home equity lines 14,911.6 14,102.7 13,635.7 11,519.2 6,965.3 5,194.8
Construction 13,776.7 13,893.0 11,046.9 7,845.4 4,479.8 4,002.4
Residential mortgages 32,779.7 33,830.1 29,877.3 24,553.5 17,208.1 14,248.6
Commercial real estate 12,609.5 12,567.8 12,516.0 12,083.8 9,330.1 9,101.8
Consumer:
Direct 3,963.9 4,160.1 5,060.8 6,622.3 3,539.6 3,991.3
Indirect 7,494.1 7,936.0 8,389.5 6,802.9 8,394.5 7,824.1
Credit card 854.1 350.7 264.5 175.3 133.0 111.3
Total loans $122,319.0 $121,454.3 $114,554.9 $101,426.2 $80,732.3 $73,167.9
Loans held for sale $8,851.7 $11,790.1 $13,695.6 $6,580.2 $5,552.1 $7,747.8
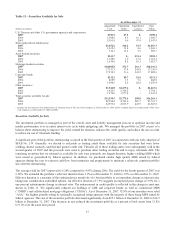
Table 6 – Funded Exposures by Selected Industries1
As of December 31, 2007 As of December 31, 2006
(Dollars in millions) Loans
% of Total
Loans Loans
% of Total
Loans
Construction $8,615.8 7.0% $7,881.1 6.5%
Real estate 8,338.5 6.8 6,782.7 5.6
Retail trade 5,445.9 4.5 5,050.6 4.2
Business services 3,821.0 3.1 4,347.9 3.6
Manufacturing 3,513.9 2.9 3,889.0 3.2
Wholesale trade 3,376.0 2.8 3,080.2 2.5
Health & social assistance 2,922.3 2.4 2,922.5 2.4
Finance & insurance 2,891.7 2.4 2,670.7 2.2
Professional, scientific & technical services 2,108.6 1.7 1,958.9 1.6
Public administration 1,864.1 1.5 1,965.2 1.6
Nonprofits 1,829.8 1.5 1,784.2 1.5
Transportation & warehousing 1,674.1 1.4 1,436.5 1.2
Information 1,456.6 1.2 1,838.3 1.5
Accommodation & food services 1,441.9 1.2 1,501.1 1.2
Arts, entertainment & recreation 1,145.1 0.9 1,206.9 1.0
Mining 1,144.2 0.9 489.8 0.4
Administrative and support 1,057.7 0.9 1,037.3 0.9
1Industry groupings are loans, in aggregate, greater than $1 billion based on the North American Industry Classification System.
Loans
Our portfolio is well diversified by product, client and geography throughout our footprint. We have relatively low exposure
to credit card and other unsecured consumer loan products.
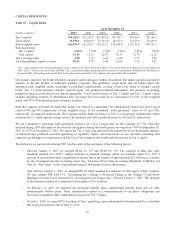
The commercial portfolio grew $1.3 billion, or 3.8%, in 2007 to $35.9 billion, or 29% of total loans, at December 31, 2007.
The commercial real estate portfolio was $12.6 billion, or 10% of total loans, and the construction portfolio was $13.8
billion, or 11% of total loans, at December 31, 2007. The construction portfolio consists of $3.6 billion of residential
construction to perm loans, $2.7 billion of residential construction loans, $3.3 billion of commercial construction loans, $2.9
billion of acquisition & development loans, and $1.3 billion of raw land loans. Commercial related construction loans
continue to perform well. Performance of residential construction related loans has deteriorated; however, we have been
30