SunTrust 2007 Annual Report Download - page 43
Download and view the complete annual report
Please find page 43 of the 2007 SunTrust annual report below. You can navigate through the pages in the report by either clicking on the pages listed below, or by using the keyword search tool below to find specific information within the annual report.-
 1
1 -
2
-
3
-
4
-
5
-
6
-
7
-
8
-
9
-
10
-
11
-
12
-
13
-
14
-
15
-
16
-
17
-
18
-
19
-
20
-
21
-
22
-
23
-
24
-
25
-
26
-
27
-
28
-
29
-
30
-
31
-
32
-
 33
33 -
 34
34 -
 35
35 -
 36
36 -
 37
37 -
 38
38 -
 39
39 -
 40
40 -
 41
41 -
 42
42 -
 43
43 -
 44
44 -
 45
45 -
 46
46 -
 47
47 -
 48
48 -
 49
49 -
 50
50 -
 51
51 -
 52
52 -
 53
53 -
54
-
55
-
56
-
57
-
58
-
59
-
60
-
61
-
62
-
63
-
64
-
65
-
66
-
67
-
68
-
69
-
70
-
71
-
72
-
73
-
74
-
75
-
76
-
77
-
78
-
79
-
80
-
81
-
82
-
83
-
84
-
85
-
86
-
87
-
88
-
89
-
90
-
91
-
92
-
93
-
94
-
95
-
96
-
97
-
98
-
99
-
100
-
101
-
102
-
103
-
104
-
105
-
106
-
107
-
108
-
109
-
110
-
111
-
112
-
113
-
114
-
115
-
116
-
117
-
118
-
119
-
120
-
121
-
122
-
123
-
124
-
125
-
126
-
127
-
128
-
129
-
130
-
131
-
132
-
133
-
134
-
135
-
136
-
137
-
138
-
139
-
140
-
141
-
142
-
143
-
144
-
145
-
146
-
147
-
148
-
149
-
150
-
151
-
152
-
153
-
154
-
155
-
156
-
157
-
158
-
159
-
160
-
161
-
162
-
163
-
164
-
165
-
166
-
167
-
168
 |
 |

proactive in our credit monitoring and management processes to provide “early warning” alerts for problem loans in the
portfolio. For example, we use an expanded liquidity and contingency analysis to provide a thorough view of borrower
capacity and their ability to service obligations in a steep market decline. We have strict limits and have exposure caps on
specific projects and borrowers for risk diversification.
Residential mortgages were $32.8 billion, or 27%, of the total loan portfolio as of December 31, 2007. Residential mortgages
are comprised of core mortgages (prime first liens), prime second lien mortgages, home equity loans, lot loans, and Alt-A
first and second mortgages. The core mortgage portfolio was $21.8 billion, or 18%, of the total loan portfolio as of
December 31, 2007. There are minimal option adjustable rate mortgages (“ARMs”) or negative amortizing loans and
virtually no subprime loans in the core portfolio. The core mortgage loans are roughly half prime jumbo and half prime
ARMs. Some of the ARMs in the core first mortgage portfolio are interest-only ARMs; however, the interest-only period is
typically ten years, unlike many interest-only products in the market which have short interest-only periods with early reset
dates. The weighted average combined loan to value (“LTV”) at origination of the core portfolio was 76% and they have a
current weighted average FICO score of 733. Prime second mortgages were $3.9 billion, or 3%, of total loans as of
December 31, 2007 and are comprised of insured purchase money second liens or combo loans with a current weighted
average FICO of 721. Home equity loans comprise $3.6 billion, or 3%, of the total loan portfolio as of December 31, 2007
and have a current weighted average FICO score of 722 and a 73% weighted average combined LTV at origination. 40% of
the home equity loans are in a first lien position. Lot loans were $1.7 billion, or approximately 1% of total loans, as of
December 31, 2007 and have a current weighted average FICO score of 729. Alt-A loans were $1.7 billion, or approximately
1% of total loans, as of December 31, 2007. Of the Alt-A loans, $1.2 billion are first liens and well secured with a weighted
average combined LTV of 77% at origination and a weighted average FICO score of 702. The remaining $0.5 billion of
Alt-A loans are second lien loans with a weighted average combined LTV of 97% at origination and a current weighted
average FICO score of 691.
The home equity line portfolio was $14.9 billion, or 12%, of the total loan portfolio as of December 31, 2007, and had a
current weighted average FICO score of 723. Approximately 25% of the portfolio was in a first lien position, and 77% of the
portfolio had a weighted average combined LTV of 90% or less at origination.
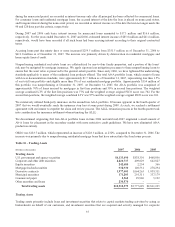
The indirect consumer portfolio was $7.5 billion, or 6% of total loans, at December 31, 2007. This portfolio primarily
consists of automobile loans generated through dealerships, has a current weighted average FICO of 701 and continues to
perform well.
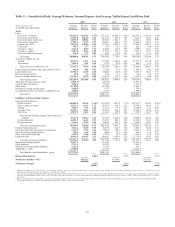
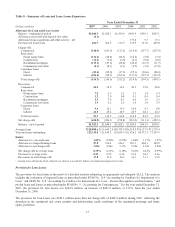
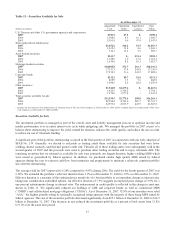
Table 7 – Allowance for Loan and Lease Losses
As of December 31
(Dollars in millions) 200712006120051200412003220022
Allocation by Loan Type
Commercial $422.6 $415.9 $439.6 $433.0 $369.3 $408.5
Real estate 664.6 443.1 394.1 369.7 159.3 150.8
Consumer loans 110.3 95.5 109.4 159.6 344.3 332.8
Unallocated 85.0 90.0 85.0 87.7 69.0 38.0
Total $1,282.5 $1,044.5 $1,028.1 $1,050.0 $941.9 $930.1
Year-end Loan Types as a Percent of Total Loans
Commercial 29.4% 28.8% 29.2% 31.6% 38.2% 39.4%
Real estate 60.6 61.2 58.7 55.2 47.0 44.5
Consumer loans 10.0 10.0 12.1 13.2 14.8 16.1
Total 100.0% 100.0% 100.0% 100.0% 100.0% 100.0%
1The allocations in the years 2004 through 2007 reflect the implementation of an ALLL methodology that is more granular than in prior periods. This
methodology segregates the portfolio into 17 sub-portfolios and incorporates a weighted average of expected loss derived from an internal risk rating
system. Beginning in 2004 the allocation also includes the acquired portfolio of NCF.
2In 2003 and prior periods, the allocation reflected an apportionment of the ALLL that had been categorized as “environmental factors,” which is now
included in the Company’s homeogeneous loan pool estimates.
Allowance for Loan and Lease Losses
We continuously monitor the quality of our loan portfolio and maintain an allowance for loan and lease losses (“ALLL”)
sufficient to absorb probable losses inherent in our loan portfolio. We are committed to the timely recognition of problem
loans and maintaining an appropriate and adequate ALLL. At year-end 2007, the ALLL was $1,282.5 million, which
31