SunTrust 2007 Annual Report Download - page 146
Download and view the complete annual report
Please find page 146 of the 2007 SunTrust annual report below. You can navigate through the pages in the report by either clicking on the pages listed below, or by using the keyword search tool below to find specific information within the annual report.-
 1
1 -
2
-
3
-
4
-
5
-
6
-
7
-
8
-
9
-
10
-
11
-
12
-
13
-
14
-
15
-
16
-
17
-
18
-
19
-
20
-
21
-
22
-
23
-
24
-
25
-
26
-
27
-
28
-
29
-
30
-
31
-
32
-
33
-
34
-
35
-
36
-
37
-
38
-
39
-
40
-
41
-
42
-
43
-
44
-
45
-
46
-
47
-
48
-
49
-
50
-
51
-
52
-
53
-
54
-
55
-
56
-
57
-
58
-
59
-
60
-
61
-
62
-
63
-
64
-
65
-
66
-
67
-
68
-
69
-
70
-
71
-
72
-
73
-
74
-
75
-
76
-
77
-
78
-
79
-
80
-
81
-
82
-
83
-
84
-
85
-
86
-
87
-
88
-
89
-
90
-
91
-
92
-
93
-
94
-
95
-
96
-
97
-
98
-
99
-
100
-
101
-
102
-
103
-
104
-
105
-
106
-
107
-
108
-
109
-
110
-
111
-
112
-
113
-
114
-
115
-
116
-
117
-
118
-
119
-
120
-
121
-
122
-
123
-
124
-
125
-
126
-
127
-
128
-
129
-
130
-
131
-
132
-
133
-
134
-
135
-
 136
136 -
 137
137 -
 138
138 -
 139
139 -
 140
140 -
 141
141 -
 142
142 -
 143
143 -
 144
144 -
 145
145 -
 146
146 -
 147
147 -
 148
148 -
 149
149 -
 150
150 -
 151
151 -
 152
152 -
 153
153 -
 154
154 -
 155
155 -
 156
156 -
157
-
158
-
159
-
160
-
161
-
162
-
163
-
164
-
165
-
166
-
167
-
168
 |
 |

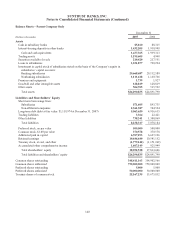
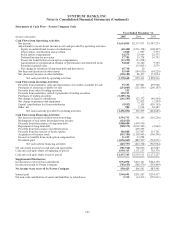
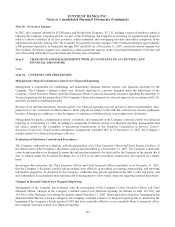
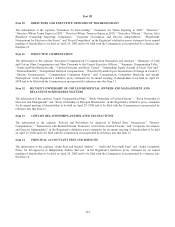
SUNTRUST BANKS, INC.
Notes to Consolidated Financial Statements (Continued)
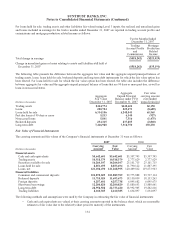
For loans held for sale, trading assets and other liabilities fair-valued using Level 3 inputs, the realized and unrealized gains
and losses included in earnings for the twelve months ended December 31, 2007 are reported in trading account profits and
commissions and mortgage production related income as follows:
Twelve Months Ended
December 31, 2007
Trading
Account Profits
and
Commissions
Mortgage
Production
Related
Income
Total change in earnings ($518,242) ($223,029)
Change in unrealized gains or losses relating to assets and liabilities still held at
December 31, 2007 ($518,242) ($35,191)
The following table presents the difference between the aggregate fair value and the aggregate unpaid principal balance of
trading assets, loans, loans held for sale, brokered deposits and long term debt instruments for which the fair value option has
been elected. For loans held for sale for which the fair value option has been elected, the table also includes the difference
between aggregate fair value and the aggregate unpaid principal balance of loans that are 90 days or more past due, as well as
loans in nonaccrual status.
(Dollars in thousands)
Aggregate
Fair Value
December 31, 2007
Aggregate
Unpaid Principal
Balance under FVO
December 31, 2007
Fair value
carrying amount
over/(under)
unpaid principal
Trading assets $444,774 $442,624 $2,150
Loans 220,784 229,473 (8,689)
Loans held for sale 6,314,106 6,248,541 65,565
Past due loans of 90 days or more 5,213 6,140 (927)
Nonaccrual loans 5,841 7,316 (1,475)
Brokered deposits 234,345 237,205 (2,860)
Long-term debt 7,446,980 7,316,750 130,230
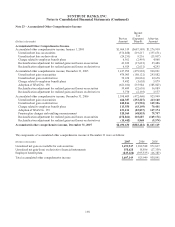
Fair Value of Financial Instruments
The carrying amounts and fair values of the Company’s financial instruments at December 31 were as follows:
2007 2006
(Dollars in thousands)
Carrying
Amount
Fair
Value
Carrying
Amount
Fair
Value
Financial assets
Cash and cash equivalents $5,642,601 $5,642,601 $5,307,745 $5,307,745
Trading assets 10,518,379 10,518,379 2,777,629 2,777,629
Securities available for sale 16,264,107 16,264,107 25,101,715 25,101,715
Loans held for sale 8,851,695 8,853,694 11,790,122 11,807,395
Loans, net 121,036,490 121,268,955 120,409,812 119,673,963
Financial liabilities
Consumer and commercial deposits 101,870,025 101,889,709 99,775,888 99,737,114
Brokered deposits 11,715,024 11,693,673 18,150,059 18,153,263
Foreign deposits 4,257,601 4,257,738 6,095,682 6,095,675
Short-term borrowings 12,200,820 12,200,820 13,880,653 13,880,661
Long-term debt 22,956,508 22,733,420 18,992,905 19,202,616
Trading liabilities 2,160,385 2,160,385 1,634,097 1,634,097
The following methods and assumptions were used by the Company in estimating the fair value of financial instruments:
• Cash and cash equivalents are valued at their carrying amounts reported in the balance sheet, which are reasonable
estimates of fair value due to the relatively short period to maturity of the instruments.
134