SunTrust 2007 Annual Report Download - page 116
Download and view the complete annual report
Please find page 116 of the 2007 SunTrust annual report below. You can navigate through the pages in the report by either clicking on the pages listed below, or by using the keyword search tool below to find specific information within the annual report.-
 1
1 -
2
-
3
-
4
-
5
-
6
-
7
-
8
-
9
-
10
-
11
-
12
-
13
-
14
-
15
-
16
-
17
-
18
-
19
-
20
-
21
-
22
-
23
-
24
-
25
-
26
-
27
-
28
-
29
-
30
-
31
-
32
-
33
-
34
-
35
-
36
-
37
-
38
-
39
-
40
-
41
-
42
-
43
-
44
-
45
-
46
-
47
-
48
-
49
-
50
-
51
-
52
-
53
-
54
-
55
-
56
-
57
-
58
-
59
-
60
-
61
-
62
-
63
-
64
-
65
-
66
-
67
-
68
-
69
-
70
-
71
-
72
-
73
-
74
-
75
-
76
-
77
-
78
-
79
-
80
-
81
-
82
-
83
-
84
-
85
-
86
-
87
-
88
-
89
-
90
-
91
-
92
-
93
-
94
-
95
-
96
-
97
-
98
-
99
-
100
-
101
-
102
-
103
-
104
-
105
-
 106
106 -
 107
107 -
 108
108 -
 109
109 -
 110
110 -
 111
111 -
 112
112 -
 113
113 -
 114
114 -
 115
115 -
 116
116 -
 117
117 -
 118
118 -
 119
119 -
 120
120 -
 121
121 -
 122
122 -
 123
123 -
 124
124 -
 125
125 -
 126
126 -
127
-
128
-
129
-
130
-
131
-
132
-
133
-
134
-
135
-
136
-
137
-
138
-
139
-
140
-
141
-
142
-
143
-
144
-
145
-
146
-
147
-
148
-
149
-
150
-
151
-
152
-
153
-
154
-
155
-
156
-
157
-
158
-
159
-
160
-
161
-
162
-
163
-
164
-
165
-
166
-
167
-
168
 |
 |

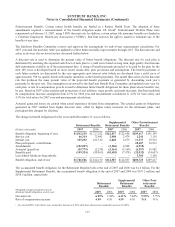
SUNTRUST BANKS, INC.
Notes to Consolidated Financial Statements (Continued)
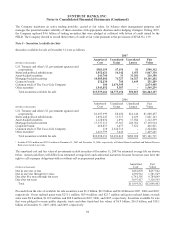
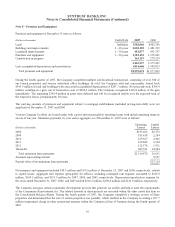
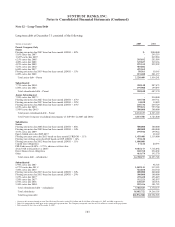
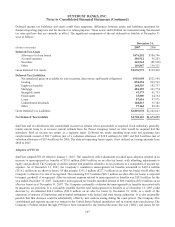
Principal amounts due for the next five years on long-term debt are: 2008 – $2,784.3 million; 2009 – $1,729.0 million; 2010
– $398.3 million; 2011 – $4,445.3 million; 2012 – $7,492.9 million; and thereafter—$6,106.7 million. Restrictive provisions
of several long-term debt agreements prevent the Company from creating liens on, disposing of, or issuing (except to related
parties) voting stock of subsidiaries. Further, there are restrictions on mergers, consolidations, certain leases, sales or
transfers of assets, minimum shareholders’ equity, and maximum borrowings by the Company. As of December 31, 2007,
the Company was in compliance with all covenants and provisions of long-term debt agreements. Long-term debt of
$2,133.3 million and $2,382.2 million as of December 31, 2007 and 2006, respectively, qualified as Tier 1 capital. As
currently defined by federal bank regulators, long-term debt of $3,073.2 million and $3,404.5 million as of December 31,
2007 and 2006, respectively, qualified as Tier 2 capital.
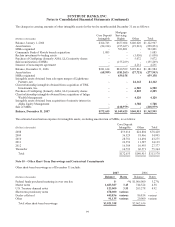
In connection with FIN 46(R), the Company does not consolidate certain wholly-owned trusts which had been formed for the
sole purpose of issuing trust preferred securities. The proceeds from the trust preferred securities issuances were invested in
junior subordinated debentures of the Parent Company and Bank Parent Company. The obligations of these debentures
constitute a full and unconditional guarantee by the Parent Company and Bank Parent Company of the trust preferred
securities.
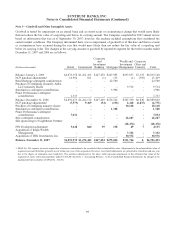
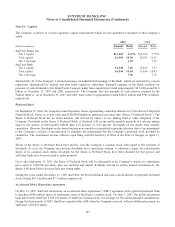
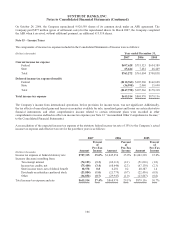
Note 13 – Earnings Per Share
Net income is the same in the calculation of basic and diluted EPS. Equivalent shares of 9.1 million and 0.3 million related to
stock options for the years ended December 31, 2007 and 2005, respectively, were excluded from the computations of diluted
EPS because they would have been antidilutive. There were no antidilutive shares for the year ending December 31, 2006. A
reconciliation of the difference between average basic common shares outstanding and average diluted common shares
outstanding for the twelve months ended December 31 is included in the following table:
(In thousands, except per share data) 2007 2006 2005
Diluted
Net income $1,634,015 $2,117,471 $1,987,239
Preferred stock dividends 30,275 7,729 -
Net income available to common shareholders $1,603,740 $2,109,742 $1,987,239
Average basic common shares 349,346 359,413 359,066
Effect of dilutive securities:
Stock options 2,396 2,261 2,723
Performance and restricted stock 946 1,128 1,665
Average diluted common shares 352,688 362,802 363,454
Earnings per average common share - diluted $4.55 $5.82 $5.47
Basic
Net income $1,634,015 $2,117,471 $1,987,239
Preferred stock dividends 30,275 7,729 -
Net income available to common shareholders $1,603,740 $2,109,742 $1,987,239
Average basic common shares 349,346 359,413 359,066
Earnings per average common share - basic $4.59 $5.87 $5.53
104