MetLife 2005 Annual Report Download - page 97
Download and view the complete annual report
Please find page 97 of the 2005 MetLife annual report below. You can navigate through the pages in the report by either clicking on the pages listed below, or by using the keyword search tool below to find specific information within the annual report.-
 1
1 -
2
-
3
-
4
-
5
-
6
-
7
-
8
-
9
-
10
-
11
-
12
-
13
-
14
-
15
-
16
-
17
-
18
-
19
-
20
-
21
-
22
-
23
-
24
-
25
-
26
-
27
-
28
-
29
-
30
-
31
-
32
-
33
-
34
-
35
-
36
-
37
-
38
-
39
-
40
-
41
-
42
-
43
-
44
-
45
-
46
-
47
-
48
-
49
-
50
-
51
-
52
-
53
-
54
-
55
-
56
-
57
-
58
-
59
-
60
-
61
-
62
-
63
-
64
-
65
-
66
-
67
-
68
-
69
-
70
-
71
-
72
-
73
-
74
-
75
-
76
-
77
-
78
-
79
-
80
-
81
-
82
-
83
-
84
-
85
-
86
-
 87
87 -
 88
88 -
 89
89 -
 90
90 -
 91
91 -
 92
92 -
 93
93 -
 94
94 -
 95
95 -
 96
96 -
 97
97 -
 98
98 -
 99
99 -
 100
100 -
 101
101 -
 102
102 -
 103
103 -
 104
104 -
 105
105 -
 106
106 -
 107
107 -
108
-
109
-
110
-
111
-
112
-
113
-
114
-
115
-
116
-
117
-
118
-
119
-
120
-
121
-
122
-
123
-
124
-
125
-
126
-
127
-
128
-
129
-
130
-
131
-
132
-
133
 |
 |

METLIFE, INC.
NOTES TO CONSOLIDATED FINANCIAL STATEMENTS — (Continued)
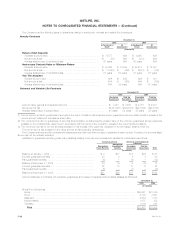
The estimated future amortization expense allocated to other expenses for the next five years for VODA and VOCRA is $6 million in 2006, $13 million
in 2007, $20 million in 2008, $26 million in 2009 and $31 million in 2010.
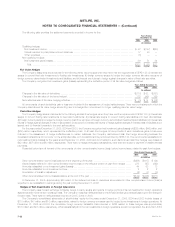
Sales Inducements
Changes in deferred sales inducements, which are reported within other assets in the consolidated balance sheet, are as follows:
Years Ended
December 31,
2005 2004
(In millions)
Balance at January 1************************************************************************************** $294 $196
Capitalization ********************************************************************************************* 140 121
Amortization********************************************************************************************** (20) (23)
Balance at December 31 ********************************************************************************** $414 $294
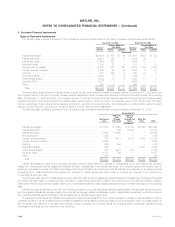
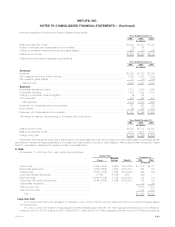
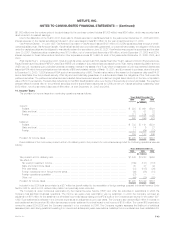
Liabilities for Unpaid Claims and Claim Expenses
The following table provides an analysis of the activity in the liability for unpaid claims and claim expenses relating to property and casualty, group
accident and non-medical health policies and contracts, which are reported within future policyholder benefits in the consolidated balance sheet:
Years Ended December 31,
2005 2004 2003
(In millions)
Balance at January 1 ************************************************************************ $ 5,824 $ 5,412 $ 4,885
Less: Reinsurance recoverables ************************************************************* (486) (525) (498)
Net balance at January 1 ******************************************************************** 5,338 4,887 4,387
Acquisitions, net **************************************************************************** 120 — —
Incurred related to:
Current year ***************************************************************************** 4,954 4,591 4,483
Prior years ******************************************************************************* (197) (29) 45
4,757 4,562 4,528
Paid related to:
Current year ***************************************************************************** (2,841) (2,717) (2,676)
Prior years ******************************************************************************* (1,373) (1,394) (1,352)
(4,214) (4,111) (4,028)
Net Balance at December 31 ***************************************************************** 6,001 5,338 4,887
Add: Reinsurance recoverables ************************************************************* 589 486 525
Balance at December 31 ******************************************************************** $ 6,590 $ 5,824 $ 5,412
As a result of changes in estimates of insured events in the prior years, the claims and claim adjustment expenses decreased $197 million in 2005
due to a reduction in prior year automobile bodily injury and homeowners severity as well as refinement in the estimation methodology for non-medical
health long-term care claim reserves.
In 2004, the claims and claim adjustment expenses decreased by $29 million due to a decrease in property an casualty prior year unallocated
expense reserves and improved loss ratios in non-medical health long-term care.
In 2003, the claims and claim adjustment expenses increased by $45 million as a result of higher than anticipated losses and related claims
expenses in automobile bodily injury coverage driven by actual inflation factors being greater than assumed inflation factors for these claims. The
increases were partially offset by improved claims management on non-medical health long-term care.
Guarantees
The Company issues annuity contracts which may include contractual guarantees to the contractholder for: (i) return of no less than total deposits
made to the contract less any partial withdrawals (‘‘return of net deposits’’) and (ii) the highest contract value on a specified anniversary date minus any
withdrawals following the contract anniversary, or total deposits made to the contract less any partial withdrawals plus a minimum return (‘‘anniversary
contract value’’ or ‘‘minimum return’’). The Company also issues annuity contracts that apply a lower rate of funds deposited if the contractholder elects to
surrender the contract for cash and a higher rate if the contractholder elects to annuitize (‘‘two tier annuities’’). These guarantees include benefits that are
payable in the event of death or at annuitization.
The Company also issues universal and variable life contracts where the Company contractually guarantees to the contractholder a secondary
guarantee or a guaranteed paid up benefit.
MetLife, Inc. F-35