MetLife 2005 Annual Report Download - page 121
Download and view the complete annual report
Please find page 121 of the 2005 MetLife annual report below. You can navigate through the pages in the report by either clicking on the pages listed below, or by using the keyword search tool below to find specific information within the annual report.-
 1
1 -
2
-
3
-
4
-
5
-
6
-
7
-
8
-
9
-
10
-
11
-
12
-
13
-
14
-
15
-
16
-
17
-
18
-
19
-
20
-
21
-
22
-
23
-
24
-
25
-
26
-
27
-
28
-
29
-
30
-
31
-
32
-
33
-
34
-
35
-
36
-
37
-
38
-
39
-
40
-
41
-
42
-
43
-
44
-
45
-
46
-
47
-
48
-
49
-
50
-
51
-
52
-
53
-
54
-
55
-
56
-
57
-
58
-
59
-
60
-
61
-
62
-
63
-
64
-
65
-
66
-
67
-
68
-
69
-
70
-
71
-
72
-
73
-
74
-
75
-
76
-
77
-
78
-
79
-
80
-
81
-
82
-
83
-
84
-
85
-
86
-
87
-
88
-
89
-
90
-
91
-
92
-
93
-
94
-
95
-
96
-
97
-
98
-
99
-
100
-
101
-
102
-
103
-
104
-
105
-
106
-
107
-
108
-
109
-
110
-
 111
111 -
 112
112 -
 113
113 -
 114
114 -
 115
115 -
 116
116 -
 117
117 -
 118
118 -
 119
119 -
 120
120 -
 121
121 -
 122
122 -
 123
123 -
 124
124 -
 125
125 -
 126
126 -
 127
127 -
 128
128 -
 129
129 -
 130
130 -
 131
131 -
132
-
133
 |
 |

METLIFE, INC.
NOTES TO CONSOLIDATED FINANCIAL STATEMENTS — (Continued)
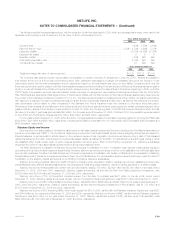
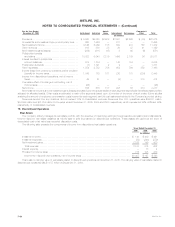
The following weighted-average assumptions, with the exception of risk-free rates used in 2005 which are expressed as a range, were used in the
applicable option-pricing model to determine the fair value of stock options issued for the:
Years Ended December 31,
2005 2004 2003
Dividend yield **************************************************************************** 1.20% 0.70% 0.68%
Risk-free rate of return ********************************************************************* 3.33% - 4.70% 3.69% 5.07%
Expected volatility ************************************************************************* 23.23% 34.85% 37.39%
Expected life (years) *********************************************************************** 666
Exercise multiple ************************************************************************** 1.48% N/A N/A
Post-vesting termination rate **************************************************************** 5.19% N/A N/A
Contractual term (years) ******************************************************************** 10 N/A N/A
Years Ended December 31,
2005 2004 2003
Weighted average fair value of options granted **************************************************** $10.09 $13.25 $10.41
The Company also awards long-term stock-based compensation to certain members of management. Under the LTPCP, awards are payable in
their entirety at the end of a three-year performance period. Each participant was assigned a target compensation amount at the inception of the
performance period with the final compensation amount determined based on the total shareholder return on the Holding Company’s stock over the
three-year performance period, subject to limited further adjustment approved by the Holding Company’s Board of Directors. Final awards may be paid in
whole or in part with shares of the Holding Company’s stock, as approved by the Holding Company’s Board of Directors. Beginning in 2005, no further
LTPCP target compensation amounts were set. Instead, certain members of management were awarded Performance Shares under the 2005 Stock
Plan. Participants are awarded an initial target number of Performance Shares with the final number of Performance Shares payable being determined by
the product of the initial target multiplied by a factor of 0.0 to 2.0. The factor applied is based on measurements of the Holding Company’s performance
with respect to (i) change in annual net operating earnings per share; and (ii) proportionate total shareholder return, as defined, with reference to the three-
year performance period relative to other companies in the Standard and Poor’s Insurance Index with reference to the same three-year period.
Performance Share awards will normally vest in their entirety at the end of the three-year performance period (subject to certain contingencies) and will be
payable entirely in shares of the Holding Company’s stock. On April 15, 2005, the Company granted 1,036,950 Performance Shares for which the total
fair value on the date of grant was approximately $40 million. For the years ended December 31, 2005, 2004 and 2003, compensation expense related
to the LTPCP and Performance Shares was $70 million, $49 million, and $45 million, respectively.
For the years ended December 31, 2005, 2004 and 2003, the aggregate stock-based compensation expense related to the Incentive Plans was
$120 million, $89 million and $63 million, respectively, including stock-based compensation for non-employees of $235 thousand, $468 thousand and
$550 thousand, respectively.
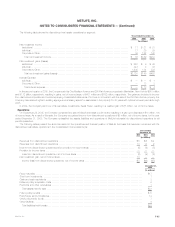
Statutory Equity and Income
Each insurance company’s state of domicile imposes minimum risk-based capital requirements that were developed by the National Association of
Insurance Commissioners (‘‘NAIC’’). The formulas for determining the amount of risk-based capital specify various weighting factors that are applied to
financial balances or various levels of activity based on the perceived degree of risk. Regulatory compliance is determined by a ratio of total adjusted
capital, as defined by the NAIC, to authorized control level risk-based capital, as defined by the NAIC. Companies below specific trigger points or ratios
are classified within certain levels, each of which requires specified corrective action. Each of the Holding Company’s U.S. insurance subsidiaries
exceeded the minimum risk-based capital requirements for all periods presented herein.
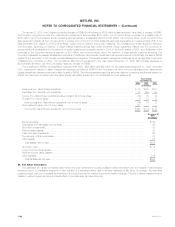
The NAIC adopted the Codification of Statutory Accounting Principles (‘‘Codification’’) in 2001. Codification was intended to standardize regulatory
accounting and reporting to state insurance departments. However, statutory accounting principles continue to be established by individual state laws
and permitted practices. The New York State Department of Insurance has adopted Codification with certain modifications for the preparation of statutory
financial statements of insurance companies domiciled in New York. Modifications by the various state insurance departments may impact the effect of
Codification on the statutory capital and surplus of the Holding Company’s insurance subsidiaries.
Statutory accounting practices differ from GAAP primarily by charging policy acquisition costs to expense as incurred, establishing future policy
benefit liabilities using different actuarial assumptions, reporting surplus notes as surplus instead of debt and valuing securities on a different basis.
Statutory net income of Metropolitan Life, a New York domiciled insurer, was $2,155 million, $2,648 million and $2,169 million for the years ended
December 31, 2005, 2004 and 2003, respectively. Statutory capital and surplus, as filed with the New York State Department of Insurance, was
$8,639 million and $8,804 million at December 31, 2005 and 2004, respectively.
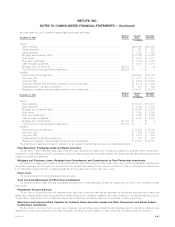
Statutory net income of TIC, a Connecticut domiciled insurer, from the date of purchase was $470 million for the six month period ended
December 31, 2005. Statutory capital and surplus, as filed with the Connecticut Insurance Department, was $4,081 million at December 31, 2005.
Statutory net income of MPC, a Rhode Island domiciled insurer, was $289 million, $356 million and $329 million for the years ended December 31,
2005, 2004 and 2003, respectively. Statutory capital and surplus, as filed with the Insurance Department of Rhode Island, was $1,783 million and
$1,875 million at December 31, 2005 and 2004, respectively.
Statutory net income of MTL (including MIAC), which was merged into MTL in 2004, as filed with the Delaware Insurance Department, was $353
and $144 million for the years ended December 31, 2005 and 2004, respectively. Statutory net income of MIAC, as filed with the Delaware Insurance
Department, was $341 million for the year ended December 31, 2003. Statutory capital and surplus of MTL, as filed, which includes MIAC, was
$690 million and $1,195 million as of December 31, 2005 and 2004, respectively.
MetLife, Inc. F-59