MetLife 2005 Annual Report Download - page 32
Download and view the complete annual report
Please find page 32 of the 2005 MetLife annual report below. You can navigate through the pages in the report by either clicking on the pages listed below, or by using the keyword search tool below to find specific information within the annual report.-
 1
1 -
2
-
3
-
4
-
5
-
6
-
7
-
8
-
9
-
10
-
11
-
12
-
13
-
14
-
15
-
16
-
17
-
18
-
19
-
20
-
21
-
 22
22 -
 23
23 -
 24
24 -
 25
25 -
 26
26 -
 27
27 -
 28
28 -
 29
29 -
 30
30 -
 31
31 -
 32
32 -
 33
33 -
 34
34 -
 35
35 -
 36
36 -
 37
37 -
 38
38 -
 39
39 -
 40
40 -
 41
41 -
 42
42 -
43
-
44
-
45
-
46
-
47
-
48
-
49
-
50
-
51
-
52
-
53
-
54
-
55
-
56
-
57
-
58
-
59
-
60
-
61
-
62
-
63
-
64
-
65
-
66
-
67
-
68
-
69
-
70
-
71
-
72
-
73
-
74
-
75
-
76
-
77
-
78
-
79
-
80
-
81
-
82
-
83
-
84
-
85
-
86
-
87
-
88
-
89
-
90
-
91
-
92
-
93
-
94
-
95
-
96
-
97
-
98
-
99
-
100
-
101
-
102
-
103
-
104
-
105
-
106
-
107
-
108
-
109
-
110
-
111
-
112
-
113
-
114
-
115
-
116
-
117
-
118
-
119
-
120
-
121
-
122
-
123
-
124
-
125
-
126
-
127
-
128
-
129
-
130
-
131
-
132
-
133
 |
 |

from the comparable 2003 period mainly as a result of a decrease in GICs sold in 2004 as compared to 2003, partially offset by an increase in MetLife
Bank’s customer deposits, particularly in the personal and business savings accounts. The 2003 period included payments of $1,006 million received on
the settlement of common stock purchase contracts (see ‘‘— Results of Operations — MetLife Capital Trust I’’) and $317 million net cash proceeds
associated with RGA’s issuance of common stock. The Company also doubled its annual dividend per share in 2004. These items were partially offset
by additional proceeds from the issuance of senior notes by the Holding Company and a decrease in repayments of long-term debt for the comparable
periods.
The Holding Company
Capital
Restrictions and Limitations on Bank Holding Companies and Financial Holding Companies — Capital. The Holding Company and its insured
depository institution subsidiary, MetLife Bank, are subject to risk-based and leverage capital guidelines issued by the federal banking regulatory
agencies for banks and financial holding companies. The federal banking regulatory agencies are required by law to take specific prompt corrective
actions with respect to institutions that do not meet minimum capital standards. At December 31, 2005, MetLife, Inc. and MetLife Bank met the minimum
capital standards as per federal banking regulatory agencies with all of MetLife Bank’s risk-based and leverage capital ratios meeting the federal banking
regulatory agencies ‘‘well capitalized’’ standards and all of MetLife, Inc.’s risk-based and leverage capital ratios meeting the ‘‘adequately capitalized’’
standards. At December 31, 2004, MetLife, Inc. and MetLife Bank were in compliance with the aforementioned minimum capital standards and each had
risk-based and leverage capital ratios that met the federal banking regulatory agencies ‘‘well capitalized’’ standards.
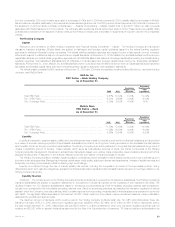
The following table contains the RBC ratios as of December 31, 2005 and 2004 and the regulatory requirements for MetLife Inc., as a bank holding
company, and MetLife Bank:
MetLife, Inc.
RBC Ratios — Bank Holding Company
As of December 31,
Regulatory
Regulatory Requirements
Requirements ‘‘Well
2005 2004 Minimum Capitalized’’
Total RBC Ratio ******************************************************* 9.57% 10.12% 8.00% 10.00%
Tier 1 RBC Ratio ****************************************************** 9.21% 9.66% 4.00% 6.00%
Tier 1 Leverage Ratio*************************************************** 5.39% 6.02% 4.00% N/A
MetLife Bank
RBC Ratios — Bank
As of December 31,
Regulatory
Regulatory Requirements
Requirements ‘‘Well
2005 2004 Minimum Capitalized’’
Total RBC Ratio ****************************************************** 11.78% 17.09% 8.00% 10.00%
Tier 1 RBC Ratio ***************************************************** 11.22% 16.38% 4.00% 6.00%
Tier 1 Leverage Ratio************************************************** 5.96% 10.84% 4.00% 5.00%
Liquidity
Liquidity is managed to preserve stable, reliable and cost-effective sources of cash to meet all current and future financial obligations and is provided
by a variety of sources, including a portfolio of liquid assets, a diversified mix of short- and long-term funding sources from the wholesale financial markets
and the ability to borrow through committed credit facilities. The Holding Company is an active participant in the global financial markets through which it
obtains a significant amount of funding. These markets, which serve as cost-effective sources of funds, are critical components of the Holding
Company’s liquidity management. Decisions to access these markets are based upon relative costs, prospective views of balance sheet growth and a
targeted liquidity profile. A disruption in the financial markets could limit the Holding Company’s access to liquidity.
The Holding Company’s ability to maintain regular access to competitively priced wholesale funds is fostered by its current high credit ratings from
the major credit rating agencies. Management views its capital ratios, credit quality, stable and diverse earnings streams, diversity of liquidity sources and
its liquidity monitoring procedures as critical to retaining high credit ratings.
Liquidity is monitored through the use of internal liquidity risk metrics, including the composition and level of the liquid asset portfolio, timing
differences in short-term cash flow obligations, access to the financial markets for capital and debt transactions and exposure to contingent draws on the
Holding Company’s liquidity.
Liquidity Sources
Dividends. The primary source of the Holding Company’s liquidity is dividends it receives from its insurance subsidiaries. The Holding Company’s
insurance subsidiaries are subject to regulatory restrictions on the payment of dividends imposed by the regulators of their respective domiciles. The
dividend limitation for U.S. insurance subsidiaries is based on the surplus to policyholders as of the immediately preceding calendar year and statutory
net gain from operations for the immediately preceding calendar year. Statutory accounting practices, as prescribed by insurance regulators of various
states in which the Company conducts business, differ in certain respects from accounting principles used in financial statements prepared in conformity
with GAAP. The significant differences relate to the treatment of DAC, certain deferred income taxes, required investment reserves, reserve calculation
assumptions, goodwill and surplus notes.
The maximum amount of dividends which could be paid to the Holding Company by Metropolitan Life, TIC, MPC and Metropolitan Tower Life
Insurance Company (‘‘MTL’’), in 2005, without prior regulatory approval, was $880 million, $0 million, $187 million and $119 million, respectively. During
the year ended December 31, 2005, Metropolitan Life paid $880 million in ordinary dividends for which prior insurance regulatory approval was not
required and $2,320 million in special dividends as approved by the New York Superintendent of Insurance. TIC has not paid any dividends since its
MetLife, Inc. 29