MetLife 2005 Annual Report Download - page 12
Download and view the complete annual report
Please find page 12 of the 2005 MetLife annual report below. You can navigate through the pages in the report by either clicking on the pages listed below, or by using the keyword search tool below to find specific information within the annual report.-
 1
1 -
 2
2 -
 3
3 -
 4
4 -
 5
5 -
 6
6 -
 7
7 -
 8
8 -
 9
9 -
 10
10 -
 11
11 -
 12
12 -
 13
13 -
 14
14 -
 15
15 -
 16
16 -
 17
17 -
 18
18 -
 19
19 -
 20
20 -
 21
21 -
 22
22 -
23
-
24
-
25
-
26
-
27
-
28
-
29
-
30
-
31
-
32
-
33
-
34
-
35
-
36
-
37
-
38
-
39
-
40
-
41
-
42
-
43
-
44
-
45
-
46
-
47
-
48
-
49
-
50
-
51
-
52
-
53
-
54
-
55
-
56
-
57
-
58
-
59
-
60
-
61
-
62
-
63
-
64
-
65
-
66
-
67
-
68
-
69
-
70
-
71
-
72
-
73
-
74
-
75
-
76
-
77
-
78
-
79
-
80
-
81
-
82
-
83
-
84
-
85
-
86
-
87
-
88
-
89
-
90
-
91
-
92
-
93
-
94
-
95
-
96
-
97
-
98
-
99
-
100
-
101
-
102
-
103
-
104
-
105
-
106
-
107
-
108
-
109
-
110
-
111
-
112
-
113
-
114
-
115
-
116
-
117
-
118
-
119
-
120
-
121
-
122
-
123
-
124
-
125
-
126
-
127
-
128
-
129
-
130
-
131
-
132
-
133
 |
 |
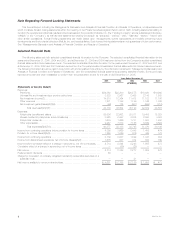
The management’s discussion and analysis which follows isolates, in order to be meaningful, the results of the Travelers acquisition in the period
over period comparison as the Travelers acquisition was not included in the results of the Company until July 1, 2005. The Travelers’ amounts which have
been isolated represent the results of the Travelers legal entities which have been acquired. These amounts represent the impact of the Travelers
acquisition; however, as business currently transacted through the acquired Travelers legal entities is transitioned to legal entities already owned by the
Company, some of which has already occurred, the identification of the Travelers legal entity business will not necessarily be indicative of the impact of
the Travelers acquisition on the results of the Company.
As a part of the Travelers acquisition, management realigned certain products and services within several of the Company’s segments to better
conform to the way it manages and assesses its business. Accordingly, all prior period segment results have been adjusted to reflect such product
reclassifications. Also in connection with the Travelers acquisition, management has utilized its economic capital model to evaluate the deployment of
capital based upon the unique and specific nature of the risks inherent in the Company’s existing and newly acquired businesses and has adjusted such
allocations based upon this model.
Year ended December 31, 2005 compared with the year ended December 31, 2004
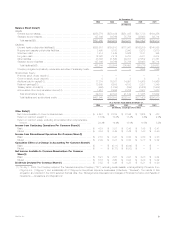
The Company reported $4,651 million in net income available to common shareholders and diluted earnings per common share of $6.16 for the
year ended December 31, 2005 compared to $2,758 million in net income available to common shareholders and diluted earnings per common share of
$3.65 for the year ended December 31, 2004. The acquisition of Travelers contributed $233 million to net income available to common shareholders for
the year ended December 31, 2005. Excluding the impact of Travelers, net income available to common shareholders increased by $1,660 million in the
2005 period. The years ended December 31, 2005 and 2004 include the impact of certain transactions or events, the timing, nature and amount of
which are generally unpredictable. These transactions are described in each applicable segment’s discussion below. These items contributed a benefit
of $71 million, net of income taxes, to the year ended December 31, 2005 and a benefit of $113 million, net of income taxes, to the comparable 2004
period. Excluding the impact of these items, net income available to common shareholders increased by $1,702 million for the year ended December 31,
2005 compared to the prior 2004 period.
In 2005, the Company sold its One Madison Avenue and 200 Park Avenue properties in Manhattan, New York, which, combined, resulted in a gain
of $1,193 million, net of income taxes. In addition, during 2005, the Company completed the sales of SSRM and MetLife Indonesia and recognized gains
of $177 million and $10 million, respectively, both net of income taxes. In 2004, the Company completed the sale of the Sears Tower property resulting in
a gain of $85 million, net of income taxes. Accordingly, income from discontinued operations and, correspondingly, net income, increased by
$1,368 million for the year ended December 31, 2005 compared to the 2004 period primarily as a result of the aforementioned sales.
These increases were partially offset by an increase in net investment losses of $170 million, net of income taxes, for the year ended December 31,
2005 as compared to the corresponding period in 2004. The acquisition of Travelers contributed a loss of $132 million, net of income taxes, to this
decrease. Excluding the impact of Travelers, net investment gains (losses) decreased by $38 million, net of income taxes, in the 2005 period. This
decrease is primarily due to losses on fixed maturity security sales resulting from continued portfolio repositioning in the 2005 period. Significantly
offsetting these reductions is an increase in gains from the mark-to-market on derivatives in 2005. The derivative gains resulted from changes in the value
of the dollar versus major foreign currencies, including the euro and pound sterling, and changes in U.S. interest rates during the year ended
December 31, 2005.
The increase in net income available to common shareholders during the year ended December 31, 2005 as compared to the prior year is partially
due to the decrease in net income available to common shareholders in the prior year of $86 million, net of income taxes, as a result of a cumulative
effect of a change in accounting principle in 2004 recorded in accordance with Statement of Position (‘‘SOP’’) 03-1, Accounting and Reporting by
Insurance Enterprises for Certain Nontraditional Long-Duration Contracts and for Separate Accounts (‘‘SOP 03-1’’).
In addition, during the second half of the year ended December 31, 2005, the Company paid $63 million in dividends on its Series A and Series B
preferred shares issued in connection with financing the acquisition of Travelers.
The remaining increase in net income available to common shareholders of $349 million is primarily due to an increase in premiums, fees and other
revenues primarily from continued sales growth across most of the Company’s business segments, as well as the positive impact of the U.S. financial
markets on policy fees. Policy fees from variable life and annuity and investment-type products are typically calculated as a percentage of the average
assets in policyholder accounts. The value of these assets can fluctuate depending on equity performance. In addition, continued strong investment
spreads are largely due to higher than expected net investment income from corporate joint venture income and bond and commercial mortgage
prepayment fees. Partially offsetting these increases is a rise in expenses primarily due to higher interest expense, integration costs, corporate incentive
expenses, non deferrable volume-related expenses, corporate support expenses and DAC amortization.
Year ended December 31, 2004 compared with the year ended December 31, 2003
The Company reported $2,758 million in net income available to common shareholders and diluted earnings per common share of $3.65 for the
year ended December 31, 2004 compared to $2,196 million in net income available to common shareholders and diluted earnings per common share of
$2.94 for the year ended December 31, 2003. Continued top-line revenue growth across all of the Company’s business segments, strong interest rate
spreads and an improvement in net investment gains (losses) are the leading contributors to the 26% increase in net income available to common
shareholders for the year ended December 31, 2004 over the comparable 2003 period.
Total premiums, fees and other revenues increased to $26.3 billion, up 8%, from the year ended December 31, 2003, primarily from continued sales
growth across most of the Company’s business segments, as well as the positive impact of the U.S. financial markets on policy fees. Policy fees from
variable life and annuity and investment-type products are typically calculated as a percentage of the average assets in policyholder accounts. The value
of these assets can fluctuate depending on equity performance. Continued strong investment spreads are largely due to higher than expected net
investment income from corporate joint venture income and bond and commercial mortgage prepayment fees. In addition, an improvement in net
investment gains (losses), net of income taxes, of $461 million is primarily due to the more favorable economic environment in 2004.
These increases are partially offset by an $86 million, net of income taxes, cumulative effect of a change in accounting principle in 2004 recorded in
accordance with SOP 03-1. In comparison, in the 2003 period the Company recorded a $26 million charge for a cumulative effect of a change in
accounting in accordance with Financial Accounting Standards Board (‘‘FASB’’) Statement 133 Implementation Issue No. B36, Embedded Derivatives:
Modified Coinsurance Arrangements and Debt Instruments That Incorporate Credit Risk Exposures That Are Unrelated or Only Partially Related to the
Creditworthiness of the Obligor under Those Instruments (‘‘Issue B36’’).
MetLife, Inc. 9