MetLife 2005 Annual Report Download - page 6
Download and view the complete annual report
Please find page 6 of the 2005 MetLife annual report below. You can navigate through the pages in the report by either clicking on the pages listed below, or by using the keyword search tool below to find specific information within the annual report.-
 1
1 -
 2
2 -
 3
3 -
 4
4 -
 5
5 -
 6
6 -
 7
7 -
 8
8 -
 9
9 -
 10
10 -
 11
11 -
 12
12 -
 13
13 -
 14
14 -
 15
15 -
 16
16 -
 17
17 -
18
-
19
-
20
-
21
-
22
-
23
-
24
-
25
-
26
-
27
-
28
-
29
-
30
-
31
-
32
-
33
-
34
-
35
-
36
-
37
-
38
-
39
-
40
-
41
-
42
-
43
-
44
-
45
-
46
-
47
-
48
-
49
-
50
-
51
-
52
-
53
-
54
-
55
-
56
-
57
-
58
-
59
-
60
-
61
-
62
-
63
-
64
-
65
-
66
-
67
-
68
-
69
-
70
-
71
-
72
-
73
-
74
-
75
-
76
-
77
-
78
-
79
-
80
-
81
-
82
-
83
-
84
-
85
-
86
-
87
-
88
-
89
-
90
-
91
-
92
-
93
-
94
-
95
-
96
-
97
-
98
-
99
-
100
-
101
-
102
-
103
-
104
-
105
-
106
-
107
-
108
-
109
-
110
-
111
-
112
-
113
-
114
-
115
-
116
-
117
-
118
-
119
-
120
-
121
-
122
-
123
-
124
-
125
-
126
-
127
-
128
-
129
-
130
-
131
-
132
-
133
 |
 |

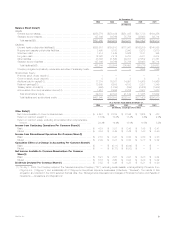
At December 31,
2005 2004 2003 2002 2001
(In millions)
Balance Sheet Data(1)
Assets:
General account assets******************************************** $353,776 $270,039 $251,085 $217,733 $194,256
Separate account assets******************************************* 127,869 86,769 75,756 59,693 62,714
Total assets(5)(6)************************************************ $481,645 $356,808 $326,841 $277,426 $256,970
Liabilities:
Life and health policyholder liabilities(9) ******************************* $258,881 $193,612 $177,947 $162,986 $148,598
Property and casualty policyholder liabilities**************************** 3,490 3,180 2,943 2,673 2,610
Short-term debt ************************************************** 1,414 1,445 3,642 1,161 355
Long-term debt*************************************************** 12,022 7,412 5,703 4,411 3,614
Other liabilities **************************************************** 48,868 41,566 39,701 27,852 21,761
Separate account liabilities ***************************************** 127,869 86,769 75,756 59,693 62,714
Total liabilities(5)(6)*********************************************** 452,544 333,984 305,692 258,776 239,652
Company-obligated mandatorily redeemable securities of subsidiary trusts** — — — 1,265 1,256
Stockholders’ Equity:
Preferred stock, at par value(10)************************************* 1————
Common stock, at par value(10) ************************************ 88888
Additional paid-in capital(10) **************************************** 17,274 15,037 14,991 14,968 14,966
Retained earnings(10)********************************************** 10,865 6,608 4,193 2,807 1,349
Treasury stock, at cost(10) ***************************************** (959) (1,785) (835) (2,405) (1,934)
Accumulated other comprehensive income(10) ************************ 1,912 2,956 2,792 2,007 1,673
Total stockholders’ equity***************************************** 29,101 22,824 21,149 17,385 16,062
Total liabilities and stockholders’ equity ***************************** $481,645 $356,808 $326,841 $277,426 $256,970
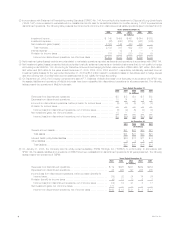
At or For the Years Ended December 31,
2005 2004 2003 2002 2001
(In millions, except per share data)
Other Data(1)
Net income available to common shareholders************************* $ 4,651 $ 2,758 $ 2,196 $ 1,605 $ 473
Return on common equity(11)*************************************** 18.5% 12.5% 11.4% 9.6% 2.9%
Return on common equity, excluding accumulated other comprehensive
income******************************************************** 20.4% 14.4% 13.0% 10.8% 3.2%
Income from Continuing Operations Per Common Share(1)
Basic *********************************************************** $ 4.19 $ 3.51 $ 2.45 $ 1.48 $ 0.41
Diluted ********************************************************** $ 4.16 $ 3.49 $ 2.42 $ 1.43 $ 0.40
Income from Discontinued Operations Per Common Share(1)
Basic *********************************************************** $ 2.10 $ 0.28 $ 0.56 $ 0.80 $ 0.23
Diluted ********************************************************** $ 2.09 $ 0.27 $ 0.55 $ 0.77 $ 0.22
Cumulative Effect of a Change in Accounting Per Common Share(1)
Basic *********************************************************** $ — $ (0.11) $ (0.04) $ — $ —
Diluted ********************************************************** $ — $ (0.11) $ (0.03) $ — $ —
Net Income Available to Common Shareholders Per Common
Share(1)
Basic *********************************************************** $ 6.21 $ 3.67 $ 2.97 $ 2.28 $ 0.64
Diluted ********************************************************** $ 6.16 $ 3.65 $ 2.94 $ 2.20 $ 0.62
Dividends Declared Per Common Share(1) ************************* $ 0.52 $ 0.46 $ 0.23 $ 0.21 $ 0.20
(1) On July 1, 2005, the Company acquired The Travelers Insurance Company (‘‘TIC’’), excluding certain assets, most significantly, Primerica, from
Citigroup Inc. (‘‘Citigroup’’), and substantially all of Citigroup’s international insurance businesses (collectively, ‘‘Travelers’’). The results of this
acquisition are reflected in the 2005 selected financial data. See ‘‘Management’s Discussion and Analysis of Financial Condition and Results of
Operations — Acquisitions and Dispositions.’’
MetLife, Inc. 3