MetLife 2005 Annual Report Download - page 51
Download and view the complete annual report
Please find page 51 of the 2005 MetLife annual report below. You can navigate through the pages in the report by either clicking on the pages listed below, or by using the keyword search tool below to find specific information within the annual report.-
 1
1 -
2
-
3
-
4
-
5
-
6
-
7
-
8
-
9
-
10
-
11
-
12
-
13
-
14
-
15
-
16
-
17
-
18
-
19
-
20
-
21
-
22
-
23
-
24
-
25
-
26
-
27
-
28
-
29
-
30
-
31
-
32
-
33
-
34
-
35
-
36
-
37
-
38
-
39
-
40
-
 41
41 -
 42
42 -
 43
43 -
 44
44 -
 45
45 -
 46
46 -
 47
47 -
 48
48 -
 49
49 -
 50
50 -
 51
51 -
 52
52 -
 53
53 -
 54
54 -
 55
55 -
 56
56 -
 57
57 -
 58
58 -
 59
59 -
 60
60 -
 61
61 -
62
-
63
-
64
-
65
-
66
-
67
-
68
-
69
-
70
-
71
-
72
-
73
-
74
-
75
-
76
-
77
-
78
-
79
-
80
-
81
-
82
-
83
-
84
-
85
-
86
-
87
-
88
-
89
-
90
-
91
-
92
-
93
-
94
-
95
-
96
-
97
-
98
-
99
-
100
-
101
-
102
-
103
-
104
-
105
-
106
-
107
-
108
-
109
-
110
-
111
-
112
-
113
-
114
-
115
-
116
-
117
-
118
-
119
-
120
-
121
-
122
-
123
-
124
-
125
-
126
-
127
-
128
-
129
-
130
-
131
-
132
-
133
 |
 |

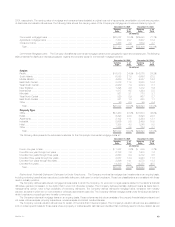
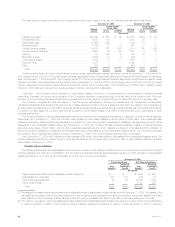
Structured Securities. The following table shows the types of structured securities the Company held at:
December 31, 2005 December 31, 2004
Estimated % of Estimated % of
Fair Value Total Fair Value Total
(In millions)
Residential mortgage-backed securities:
Collateralized mortgage obligations ************************************************ $29,679 38.8% $19,752 35.5%
Pass-through securities ********************************************************* 17,567 23.0 12,478 22.4
Total residential mortgage-backed securities ****************************************** 47,246 61.8 32,230 57.9
Commercial mortgage-backed securities ********************************************* 17,698 23.1 12,501 22.5
Asset-backed securities *********************************************************** 11,573 15.1 10,876 19.6
Total *********************************************************************** $76,517 100.0% $55,607 100.0%
The majority of the residential mortgage-backed securities are guaranteed or otherwise supported by the Federal National Mortgage Association, the
Federal Home Loan Mortgage Corporation or the Government National Mortgage Association. At December 31, 2005, $46,304 million, or 98.0%, of the
residential mortgage-backed securities were rated Aaa/AAA by Moody’s, S&P or Fitch. At December 31, 2004, $31,768 million, or 98.6%, of the
residential mortgage-backed securities were rated Aaa/AAA by Moody’s or S&P.
At December 31, 2005, $13,272 million, or 75%, of the commercial mortgage-backed securities were rated Aaa/AAA by Moody’s, S&P or Fitch. At
December 31, 2004, $8,750 million, or 70.0%, of the commercial mortgage-backed securities were rated Aaa/AAA by Moody’s or S&P.
The Company’s asset-backed securities are diversified both by sector and by issuer. Home equity loan and credit card receivables, accounting for
about 31% and 26% of the total holdings, respectively, constitute the largest exposures in the Company’s asset-backed securities portfolio. At
December 31, 2005, $6,084 million, or 52.6%, of total asset-backed securities were rated Aaa/AAA by Moody’s, S&P or Fitch. At December 31, 2004,
$6,775 million, or 62.3%, of the total asset-backed securities were rated Aaa/AAA by Moody’s or S&P.
Structured Investment Transactions. The Company participates in structured investment transactions, primarily asset securitizations and structured
notes. These transactions enhance the Company’s total return on its investment portfolio principally by generating management fee income on asset
securitizations and by providing equity-based returns on debt securities through structured notes and similar instruments.
The Company sponsors financial asset securitizations of high yield debt securities, investment grade bonds and structured finance securities and
also is the collateral manager and a beneficial interest holder in such transactions. As the collateral manager, the Company earns management fees on
the outstanding securitized asset balance, which are recorded in income as earned. When the Company transfers assets to bankruptcy-remote SPEs
and surrenders control over the transferred assets, the transaction is accounted for as a sale. Gains or losses on securitizations are determined with
reference to the carrying amount of the financial assets transferred, which is allocated to the assets sold and the beneficial interests retained based on
relative fair values at the date of transfer. Beneficial interests in securitizations are carried at fair value in fixed maturities. Income on these beneficial
interests is recognized using the prospective method. The SPEs used to securitize assets are not consolidated by the Company because the Company
has determined that it is not the primary beneficiary of these entities.
The Company purchases or receives beneficial interests in SPEs, which generally acquire financial assets, including corporate equities, debt
securities and purchased options. The Company has not guaranteed the performance, liquidity or obligations of the SPEs and the Company’s exposure
to loss is limited to its carrying value of the beneficial interests in the SPEs. The Company uses the beneficial interests as part of its risk management
strategy, including asset-liability management. These SPEs are not consolidated by the Company because the Company has determined that it is not the
primary beneficiary of these entities. These beneficial interests are generally structured notes, which are included in fixed maturities, and their income is
recognized using the retrospective interest method or the level yield method, as appropriate. Impairments of these beneficial interests are included in net
investment gains (losses).
The Company invests in structured notes and similar type instruments, which generally provide equity-based returns on debt securities. The carrying
value of such investments was approximately $362 million and $666 million at December 31, 2005 and 2004, respectively. The related net investment
income recognized was $28 million, $45 million and $78 million for the years ended December 31, 2005, 2004 and 2003, respectively.
Trading Securities
During 2005, the Company established a trading securities portfolio to support investment strategies that involve the active and frequent purchase
and sale of securities. Trading securities are recorded at fair value with subsequent changes in fair value recognized in net investment income. Net
investment income for the year ended December 31, 2005 includes $37 million of gains (losses) on securities classified as trading. Of this amount,
$42 million relates to net gains (losses) recognized on trading securities sold during the year ended December 31, 2005. The remaining ($5) million for
the year ended December 31, 2005 relates to changes in fair value on trading securities held at December 31, 2005. The Company did not have any
trading securities during the years ended December 31, 2004 and 2003.
As part of the acquisition of Travelers on July 1, 2005, the Company acquired Travelers’ investment in Tribeca Citigroup Investments Ltd. (‘‘Tribeca’’).
Tribeca is a feeder fund investment structure whereby the feeder fund invests substantially all of its assets in the master fund, Tribeca Global Convertible
Instruments Ltd. The primary investment objective of the master fund is to achieve enhanced risk-adjusted return by investing in domestic and foreign
equities and equity-related securities utilizing such strategies as convertible securities arbitrage. MetLife is the majority owner of the feeder fund and
consolidates the fund within its consolidated financial statements. Approximately $452 million of Tribeca’s investments are reported as trading securities in
the accompanying consolidated financial statements with changes in fair value recognized in net investment income.
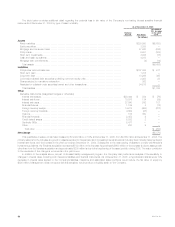
Mortgage and Consumer Loans
The Company’s mortgage and consumer loans are principally collateralized by commercial, agricultural and residential properties, as well as
automobiles. Mortgage and consumer loans comprised 12.2% and 13.6% of the Company’s total cash and invested assets at December 31, 2005 and
MetLife, Inc.
48