MetLife 2005 Annual Report Download - page 52
Download and view the complete annual report
Please find page 52 of the 2005 MetLife annual report below. You can navigate through the pages in the report by either clicking on the pages listed below, or by using the keyword search tool below to find specific information within the annual report.-
 1
1 -
2
-
3
-
4
-
5
-
6
-
7
-
8
-
9
-
10
-
11
-
12
-
13
-
14
-
15
-
16
-
17
-
18
-
19
-
20
-
21
-
22
-
23
-
24
-
25
-
26
-
27
-
28
-
29
-
30
-
31
-
32
-
33
-
34
-
35
-
36
-
37
-
38
-
39
-
40
-
41
-
 42
42 -
 43
43 -
 44
44 -
 45
45 -
 46
46 -
 47
47 -
 48
48 -
 49
49 -
 50
50 -
 51
51 -
 52
52 -
 53
53 -
 54
54 -
 55
55 -
 56
56 -
 57
57 -
 58
58 -
 59
59 -
 60
60 -
 61
61 -
 62
62 -
63
-
64
-
65
-
66
-
67
-
68
-
69
-
70
-
71
-
72
-
73
-
74
-
75
-
76
-
77
-
78
-
79
-
80
-
81
-
82
-
83
-
84
-
85
-
86
-
87
-
88
-
89
-
90
-
91
-
92
-
93
-
94
-
95
-
96
-
97
-
98
-
99
-
100
-
101
-
102
-
103
-
104
-
105
-
106
-
107
-
108
-
109
-
110
-
111
-
112
-
113
-
114
-
115
-
116
-
117
-
118
-
119
-
120
-
121
-
122
-
123
-
124
-
125
-
126
-
127
-
128
-
129
-
130
-
131
-
132
-
133
 |
 |

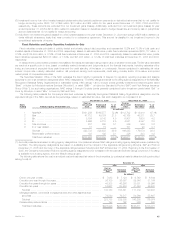
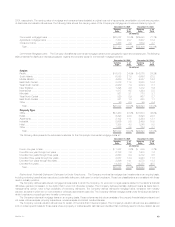
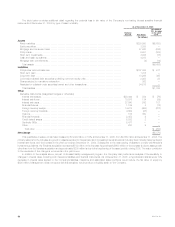
2004, respectively. The carrying value of mortgage and consumer loans is stated at original cost net of repayments, amortization of premiums, accretion
of discounts and valuation allowances. The following table shows the carrying value of the Company’s mortgage and consumer loans by type at:
December 31, 2005 December 31, 2004
Carrying % of Carrying % of
Value Total Value Total
(In millions)
Commercial mortgage loans ******************************************************* $28,022 75.4% $24,990 77.1%
Agricultural mortgage loans ******************************************************** 7,700 20.7 5,907 18.2
Consumer loans ***************************************************************** 1,468 3.9 1,509 4.7
Total ************************************************************************* $37,190 100.0% $32,406 100.0%
Commercial Mortgage Loans. The Company diversifies its commercial mortgage loans by both geographic region and property type. The following
table presents the distribution across geographic regions and property types for commercial mortgage loans at:
December 31, 2005 December 31, 2004
Carrying % of Carrying % of
Value Total Value Total
(In millions)
Region
Pacific************************************************************************** $ 6,818 24.3% $ 6,075 24.3%
South Atlantic ******************************************************************* 6,093 21.8 5,696 22.8
Middle Atlantic ******************************************************************* 4,689 16.7 4,057 16.2
East North Central**************************************************************** 3,078 11.0 2,550 10.2
West South Central*************************************************************** 2,069 7.4 2,024 8.1
New England ******************************************************************** 1,295 4.6 1,412 5.6
International ********************************************************************* 1,817 6.5 1,364 5.5
Mountain *********************************************************************** 861 3.1 778 3.1
West North Central *************************************************************** 825 2.9 667 2.7
East South Central *************************************************************** 381 1.4 268 1.1
Other ************************************************************************** 96 0.3 99 0.4
Total ************************************************************************* $28,022 100.0% $24,990 100.0%
Property Type
Office ************************************************************************** $13,453 48.0% $11,500 46.0%
Retail*************************************************************************** 6,398 22.8 5,698 22.8
Apartments********************************************************************** 3,102 11.1 3,264 13.1
Industrial ************************************************************************ 2,656 9.5 2,499 10.0
Hotel*************************************************************************** 1,355 4.8 1,245 5.0
Other ************************************************************************** 1,058 3.8 784 3.1
Total ************************************************************************* $28,022 100.0% $24,990 100.0%
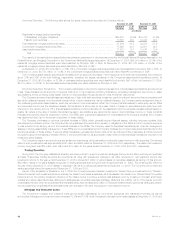
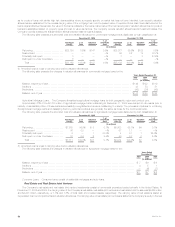
The following table presents the scheduled maturities for the Company’s commercial mortgage loans at:
December 31, 2005 December 31, 2004
Carrying % of Carrying % of
Value Total Value Total
(In millions)
Due in one year or less *********************************************************** $ 1,052 3.8% $ 939 3.7%
Due after one year through two years *********************************************** 2,138 7.6 1,800 7.2
Due after two years through three years ********************************************* 2,640 9.4 2,372 9.5
Due after three years through four years ********************************************* 4,037 14.4 2,943 11.8
Due after four years through five years *********************************************** 3,946 14.1 4,578 18.3
Due after five years *************************************************************** 14,209 50.7 12,358 49.5
Total ************************************************************************* $28,022 100.0% $24,990 100.0%
Restructured, Potentially Delinquent, Delinquent or Under Foreclosure. The Company monitors its mortgage loan investments on an ongoing basis,
including reviewing loans that are restructured, potentially delinquent, delinquent or under foreclosure. These loan classifications are consistent with those
used in industry practice.
The Company defines restructured mortgage loans as loans in which the Company, for economic or legal reasons related to the debtor’s financial
difficulties, grants a concession to the debtor that it would not otherwise consider. The Company defines potentially delinquent loans as loans that, in
management’s opinion, have a high probability of becoming delinquent. The Company defines delinquent mortgage loans, consistent with industry
practice, as loans in which two or more interest or principal payments are past due. The Company defines mortgage loans under foreclosure as loans in
which foreclosure proceedings have formally commenced.
The Company reviews all mortgage loans on an ongoing basis. These reviews may include an analysis of the property financial statements and rent
roll, lease rollover analysis, property inspections, market analysis and tenant creditworthiness.
The Company records valuation allowances for certain of the loans that it deems impaired. The Company’s valuation allowances are established
both on a loan specific basis for those loans where a property or market specific risk has been identified that could likely result in a future default, as well
MetLife, Inc. 49