MetLife 2005 Annual Report Download - page 47
Download and view the complete annual report
Please find page 47 of the 2005 MetLife annual report below. You can navigate through the pages in the report by either clicking on the pages listed below, or by using the keyword search tool below to find specific information within the annual report.-
 1
1 -
2
-
3
-
4
-
5
-
6
-
7
-
8
-
9
-
10
-
11
-
12
-
13
-
14
-
15
-
16
-
17
-
18
-
19
-
20
-
21
-
22
-
23
-
24
-
25
-
26
-
27
-
28
-
29
-
30
-
31
-
32
-
33
-
34
-
35
-
36
-
 37
37 -
 38
38 -
 39
39 -
 40
40 -
 41
41 -
 42
42 -
 43
43 -
 44
44 -
 45
45 -
 46
46 -
 47
47 -
 48
48 -
 49
49 -
 50
50 -
 51
51 -
 52
52 -
 53
53 -
 54
54 -
 55
55 -
 56
56 -
 57
57 -
58
-
59
-
60
-
61
-
62
-
63
-
64
-
65
-
66
-
67
-
68
-
69
-
70
-
71
-
72
-
73
-
74
-
75
-
76
-
77
-
78
-
79
-
80
-
81
-
82
-
83
-
84
-
85
-
86
-
87
-
88
-
89
-
90
-
91
-
92
-
93
-
94
-
95
-
96
-
97
-
98
-
99
-
100
-
101
-
102
-
103
-
104
-
105
-
106
-
107
-
108
-
109
-
110
-
111
-
112
-
113
-
114
-
115
-
116
-
117
-
118
-
119
-
120
-
121
-
122
-
123
-
124
-
125
-
126
-
127
-
128
-
129
-
130
-
131
-
132
-
133
 |
 |

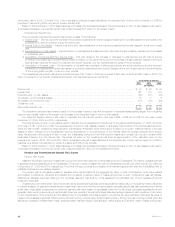
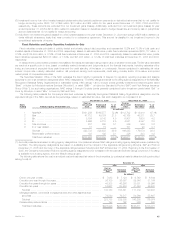
Composition of Portfolio and Investment Results
The following table illustrates the net investment income and annualized yields on average assets for each of the components of the Company’s
investment portfolio for the years ended December 31, 2005, 2004 and 2003.
December 31,
2005 2004 2003
(In millions)
FIXED MATURITIES
Yield(2) **************************************************************************** 6.02% 6.53% 6.91%
Investment income(3)***************************************************************** $ 10,424 $ 9,015 $ 8,480
Net investment gains (losses) ********************************************************** $ (868) $ 71 $ (398)
Ending assets(3)********************************************************************* $230,875 $176,377 $167,382
MORTGAGE AND CONSUMER LOANS
Yield(2) **************************************************************************** 6.81% 6.99% 7.49%
Investment income(4)***************************************************************** $ 2,236 $ 1,951 $ 1,902
Net investment gains (losses) ********************************************************** $ 17 $ (47) $ (56)
Ending assets*********************************************************************** $ 37,190 $ 32,406 $ 26,249
REAL ESTATE AND REAL ESTATE JOINT VENTURES(5)
Yield(2) **************************************************************************** 10.59% 11.69% 10.88%
Investment income******************************************************************* $ 467 $ 515 $ 513
Net investment gains (losses) ********************************************************** $ 2,139 $ 162 $ 440
Ending assets*********************************************************************** $ 4,665 $ 4,233 $ 4,677
POLICY LOANS
Yield(2) **************************************************************************** 6.00% 6.15% 6.40%
Investment income******************************************************************* $ 572 $ 541 $ 554
Ending assets*********************************************************************** $ 9,981 $ 8,899 $ 8,750
EQUITY SECURITIES AND OTHER LIMITED PARTNERSHIP INTERESTS
Yield(2) **************************************************************************** 12.44% 9.96% 3.03%
Investment income******************************************************************* $ 774 $ 404 $ 111
Net investment gains (losses) ********************************************************** $ 159 $ 208 $ (43)
Ending assets*********************************************************************** $ 7,614 $ 5,095 $ 4,183
CASH AND SHORT-TERM INVESTMENTS
Yield(2) **************************************************************************** 3.66% 3.00% 2.45%
Investment income******************************************************************* $ 362 $ 153 $ 160
Net investment gains (losses) ********************************************************** $(2)$(1)$ 1
Ending assets*********************************************************************** $ 7,324 $ 6,710 $ 5,483
OTHER INVESTED ASSETS(6)
Yield(2) **************************************************************************** 8.96% 6.55% 9.65%
Investment income******************************************************************* $ 570 $ 290 $ 324
Net investment gains (losses)(7)******************************************************** $ 502 $ (149) $ (159)
Ending assets*********************************************************************** $ 8,078 $ 5,295 $ 4,998
TOTAL INVESTMENTS
Gross investment income yield(2) ****************************************************** 6.35% 6.69% 6.88%
Investment fees and expenses yield **************************************************** (0.14)% (0.14)% (0.16)%
NET INVESTMENT INCOME YIELD ************************************************* 6.21% 6.55% 6.72%
Gross investment income ************************************************************* $ 15,405 $ 12,869 $ 12,044
Investment fees and expenses********************************************************* $ (339) $ (260) $ (276)
NET INVESTMENT INCOME(1)(5)(6)(7)*********************************************** $ 15,066 $ 12,609 $ 11,768
Ending assets(1)********************************************************************* $305,727 $239,015 $221,722
Net investment gains (losses)(1)(5)(6)(7) ************************************************* $ 1,947 $ 244 $ (215)
(1) Included in ending assets, investment income and investment gains (losses) is $7,102 million, $213 million and $8 million, respectively, related to the
consolidation of separate accounts under SOP 03-1 for the year ended December 31, 2005. Included in ending assets, investment income and
investment gains (losses) is $2,139 million, $86 million and $25 million, respectively, related to the consolidation of separate accounts under SOP
03-1 for the year ended December 31, 2004.
(2) Yields are based on quarterly average asset carrying values, excluding recognized and unrealized investment gains (losses), and for yield calculation
purposes, average assets exclude collateral associated with the Company’s securities lending program.
(3) Fixed maturities include $825 million in ending assets and $14 million in investment income relating to trading securities for the year ended
December 31, 2005. The annualized yield on trading securities was 2.74% for the year ended December 31, 2005. The Company did not have any
trading securities during the years ended December 31, 2004 and 2003.
(4) Investment income from mortgage and consumer loans includes prepayment fees.
(5) Real estate and real estate joint venture income includes amounts classified as discontinued operations of $58 million, $169 million and $212 million
for the years ended December 31, 2005, 2004 and 2003, respectively. Net investment gains (losses) include $2,125 million, $146 million and
$420 million of gains classified as discontinued operations for the years ended December 31, 2005, 2004 and 2003, respectively.
MetLife, Inc.
44