MetLife 2005 Annual Report Download - page 126
Download and view the complete annual report
Please find page 126 of the 2005 MetLife annual report below. You can navigate through the pages in the report by either clicking on the pages listed below, or by using the keyword search tool below to find specific information within the annual report.-
 1
1 -
2
-
3
-
4
-
5
-
6
-
7
-
8
-
9
-
10
-
11
-
12
-
13
-
14
-
15
-
16
-
17
-
18
-
19
-
20
-
21
-
22
-
23
-
24
-
25
-
26
-
27
-
28
-
29
-
30
-
31
-
32
-
33
-
34
-
35
-
36
-
37
-
38
-
39
-
40
-
41
-
42
-
43
-
44
-
45
-
46
-
47
-
48
-
49
-
50
-
51
-
52
-
53
-
54
-
55
-
56
-
57
-
58
-
59
-
60
-
61
-
62
-
63
-
64
-
65
-
66
-
67
-
68
-
69
-
70
-
71
-
72
-
73
-
74
-
75
-
76
-
77
-
78
-
79
-
80
-
81
-
82
-
83
-
84
-
85
-
86
-
87
-
88
-
89
-
90
-
91
-
92
-
93
-
94
-
95
-
96
-
97
-
98
-
99
-
100
-
101
-
102
-
103
-
104
-
105
-
106
-
107
-
108
-
109
-
110
-
111
-
112
-
113
-
114
-
115
-
 116
116 -
 117
117 -
 118
118 -
 119
119 -
 120
120 -
 121
121 -
 122
122 -
 123
123 -
 124
124 -
 125
125 -
 126
126 -
 127
127 -
 128
128 -
 129
129 -
 130
130 -
 131
131 -
 132
132 -
 133
133
 |
 |

METLIFE, INC.
NOTES TO CONSOLIDATED FINANCIAL STATEMENTS — (Continued)
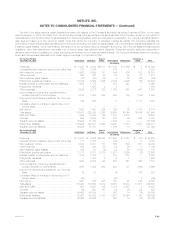
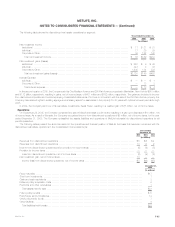
For the Year Ended Auto & Corporate &
December 31, 2003 Institutional Individual Home International Reinsurance Other Total
(In millions)
Premiums**************************************** $ 9,063 $4,363 $2,908 $1,631 $2,648 $ (38) $20,575
Universal life and investment-type product policy fees *** 660 1,564 — 271 — — 2,495
Net investment income***************************** 4,146 6,069 158 500 431 168 11,472
Other revenues *********************************** 618 380 33 80 47 41 1,199
Net investment gains (losses) *********************** (289) (311) (15) 8 62 (6) (551)
Policyholder benefits
and claims ************************************* 10,023 5,048 2,139 1,456 2,109 36 20,811
Interest credited to policyholder********************** .
account balances ******************************* 974 1,734 — 143 184 — 3,035
Policyholder dividends ***************************** (1) 1,721 2 9 — — 1,731
Other expenses*********************************** 1,854 2,783 756 652 764 359 7,168
Income (loss) from continuing operations before provision
(benefit) for income taxes ************************* 1,348 779 187 230 131 (230) 2,445
Income from discontinued operations, net of income
taxes****************************************** 49 51 — (5) — 319 414
Cumulative effect of a change in accounting, net of
income taxes *********************************** (26) — — — — — (26)
Net income ************************************** 886 570 157 208 86 310 2,217
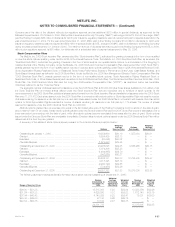
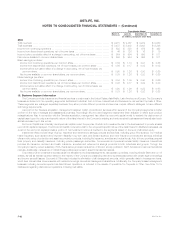
Net investment income and net investment gains (losses) are based upon the actual results of each segment’s specifically identifiable asset portfolio
adjusted for allocated capital. Other costs are allocated to each of the segments based upon: (i) a review of the nature of such costs; (ii) time studies
analyzing the amount of employee compensation costs incurred by each segment; and (iii) cost estimates included in the Company’s product pricing.
Revenues derived from any customer did not exceed 10% of consolidated revenues. Revenues from U.S. operations were $39,571 million,
$34,894 million and $31,759 million for the years ended December 31, 2005, 2004 and 2003, respectively, which represented 88%, 90% and 90%,
respectively, of consolidated revenues.
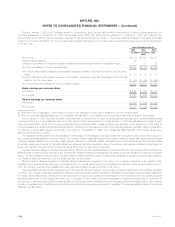
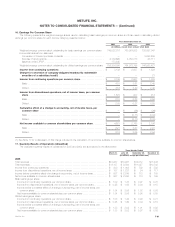
19. Discontinued Operations
Real Estate
The Company actively manages its real estate portfolio with the objective of maximizing earnings through selective acquisitions and dispositions.
Income related to real estate classified as held-for-sale or sold is presented in discontinued operations. These assets are carried at the lower of
depreciated cost or fair value less expected disposition costs.
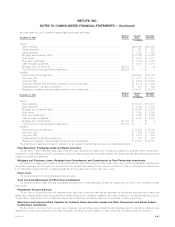
The following table presents the components of income from discontinued real estate operations:
Years Ended December 31,
2005 2004 2003
(In millions)
Investment income****************************************************************************** $ 140 $ 409 $ 491
Investment expense***************************************************************************** (82) (240) (279)
Net investment gains **************************************************************************** 2,125 146 420
Total revenues ******************************************************************************* 2,183 315 632
Interest expense******************************************************************************** —13 4
Provision for income taxes *********************************************************************** 776 105 230
Income from discontinued operations, net of income taxes ****************************************** $1,407 $ 197 $ 398
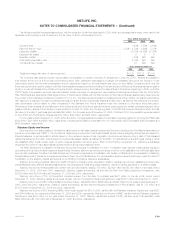
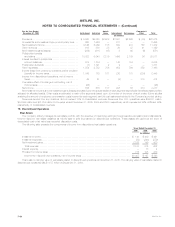
There was no carrying value of real estate related to discontinued operations at December 31, 2005. The carrying value of real estate related to
discontinued operations was $1,157 million at December 31, 2004.
MetLife, Inc.
F-64