MetLife 2005 Annual Report Download - page 59
Download and view the complete annual report
Please find page 59 of the 2005 MetLife annual report below. You can navigate through the pages in the report by either clicking on the pages listed below, or by using the keyword search tool below to find specific information within the annual report.-
 1
1 -
2
-
3
-
4
-
5
-
6
-
7
-
8
-
9
-
10
-
11
-
12
-
13
-
14
-
15
-
16
-
17
-
18
-
19
-
20
-
21
-
22
-
23
-
24
-
25
-
26
-
27
-
28
-
29
-
30
-
31
-
32
-
33
-
34
-
35
-
36
-
37
-
38
-
39
-
40
-
41
-
42
-
43
-
44
-
45
-
46
-
47
-
48
-
 49
49 -
 50
50 -
 51
51 -
 52
52 -
 53
53 -
 54
54 -
 55
55 -
 56
56 -
 57
57 -
 58
58 -
 59
59 -
 60
60 -
 61
61 -
 62
62 -
 63
63 -
 64
64 -
 65
65 -
 66
66 -
 67
67 -
 68
68 -
 69
69 -
70
-
71
-
72
-
73
-
74
-
75
-
76
-
77
-
78
-
79
-
80
-
81
-
82
-
83
-
84
-
85
-
86
-
87
-
88
-
89
-
90
-
91
-
92
-
93
-
94
-
95
-
96
-
97
-
98
-
99
-
100
-
101
-
102
-
103
-
104
-
105
-
106
-
107
-
108
-
109
-
110
-
111
-
112
-
113
-
114
-
115
-
116
-
117
-
118
-
119
-
120
-
121
-
122
-
123
-
124
-
125
-
126
-
127
-
128
-
129
-
130
-
131
-
132
-
133
 |
 |

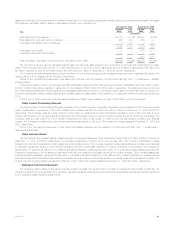
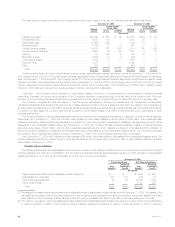
The table below provides additional detail regarding the potential loss in fair value of the Company’s non-trading interest sensitive financial
instruments at December 31, 2005 by type of asset or liability.
As of December 31, 2005
Assuming a
10% increase
Notional in the yield
Amount Fair Value curve.
(In millions)
Assets
Fixed maturities *************************************************************************** $230,050 $(5,633)
Equity securities*************************************************************************** 3,338 —
Mortgage and consumer loans ************************************************************** 37,820 (616)
Policy loans ****************************************************************************** 9,981 (324)
Short-term investments********************************************************************* 3,306 (18)
Cash and cash equivalents ***************************************************************** 4,018 —
Mortgage loan commitments **************************************************************** (4) (14)
Total assets **************************************************************************** $(6,605)
Liabilities
Policyholder account balances ************************************************************** $107,083 $ 917
Short-term debt *************************************************************************** 1,414 —
Long-term debt *************************************************************************** 10,296 395
Junior subordinated debt securities underlying common equity units ******************************* 2,098 23
Shares subject to mandatory redemption****************************************************** 362 —
Payables for collateral under securities loaned and other transactions ****************************** 34,515 —
Total liabilities *************************************************************************** $ 1,335
Other
Derivative instruments (designated hedges or otherwise)
Interest rate swaps ********************************************************************** $20,444 $ 584 $ (76)
Interest rate floors *********************************************************************** 10,975 134 (39)
Interest rate caps************************************************************************ 27,990 242 101
Financial futures************************************************************************* 1,159 4 (12)
Foreign currency swaps ****************************************************************** 14,274 (464) (227)
Foreign currency forwards **************************************************************** 4,622 (28) —
Options******************************************************************************** 815 350 —
Financial forwards *********************************************************************** 2,452 9 —
Credit default swaps ********************************************************************* 5,882 2 —
Synthetic GICs************************************************************************** 5,477 — —
Other********************************************************************************** 250 9 —
Total other *************************************************************************** $ (253)
Net change ******************************************************************************* $(5,570)
This quantitative measure of risk has increased by $1,920 million, or 53%, at December 31, 2005, from $3,650 million at December 31, 2004. The
primary reasons for the increase are growth in assets exposed to interest rate risk in increasing interest scenarios including fixed maturity instruments and
interest rate floors, and the increase in the yield curve since December 31, 2004. Subsequent to the restructuring of assets to comply with MetLife’s
investment guidelines, the Travelers acquisition represents $702 million of the increase. Approximately $600 million of the increase is due to asset growth
other than from the Travelers acquisition and approximately $200 million is due to the lengthening of the asset portfolio during 2005. The major contributor
to the remainder of the change is movements in the yield curve.
In addition to the analysis above, as part of its asset liability management program, the Company also performs an analysis of the sensitivity to
changes in interest rates, including both insurance liabilities and financial instruments. As of December 31, 2005, a hypothetical instantaneous 10%
decrease in interest rates applied to the Company’s liabilities, insurance and associated asset portfolios would reduce the fair value of equity by
$390 million. Management does not expect that this sensitivity would produce a liquidity strain on the Company.
MetLife, Inc.
56